The Fourth of July, a time of national celebration, is also the third-deadliest holiday for American drivers. An average of 430 people a year lose their lives over the Fourth of July holiday period, behind only Thanksgiving and Labor Day. We looked at 10 years of data on Fourth of July fatalities. Here’s what we found:
Alcohol, excessive speed and a sense of invincibility means younger drivers are the most frequent casualties as America celebrates Independence Day. This is especially true for men in their 20s and 30s, who were behind the wheel in 34% of all fatal Fourth of July crashes during the 10-year period through 2021, and were more likely to have been drinking and/or speeding.
Key Insights
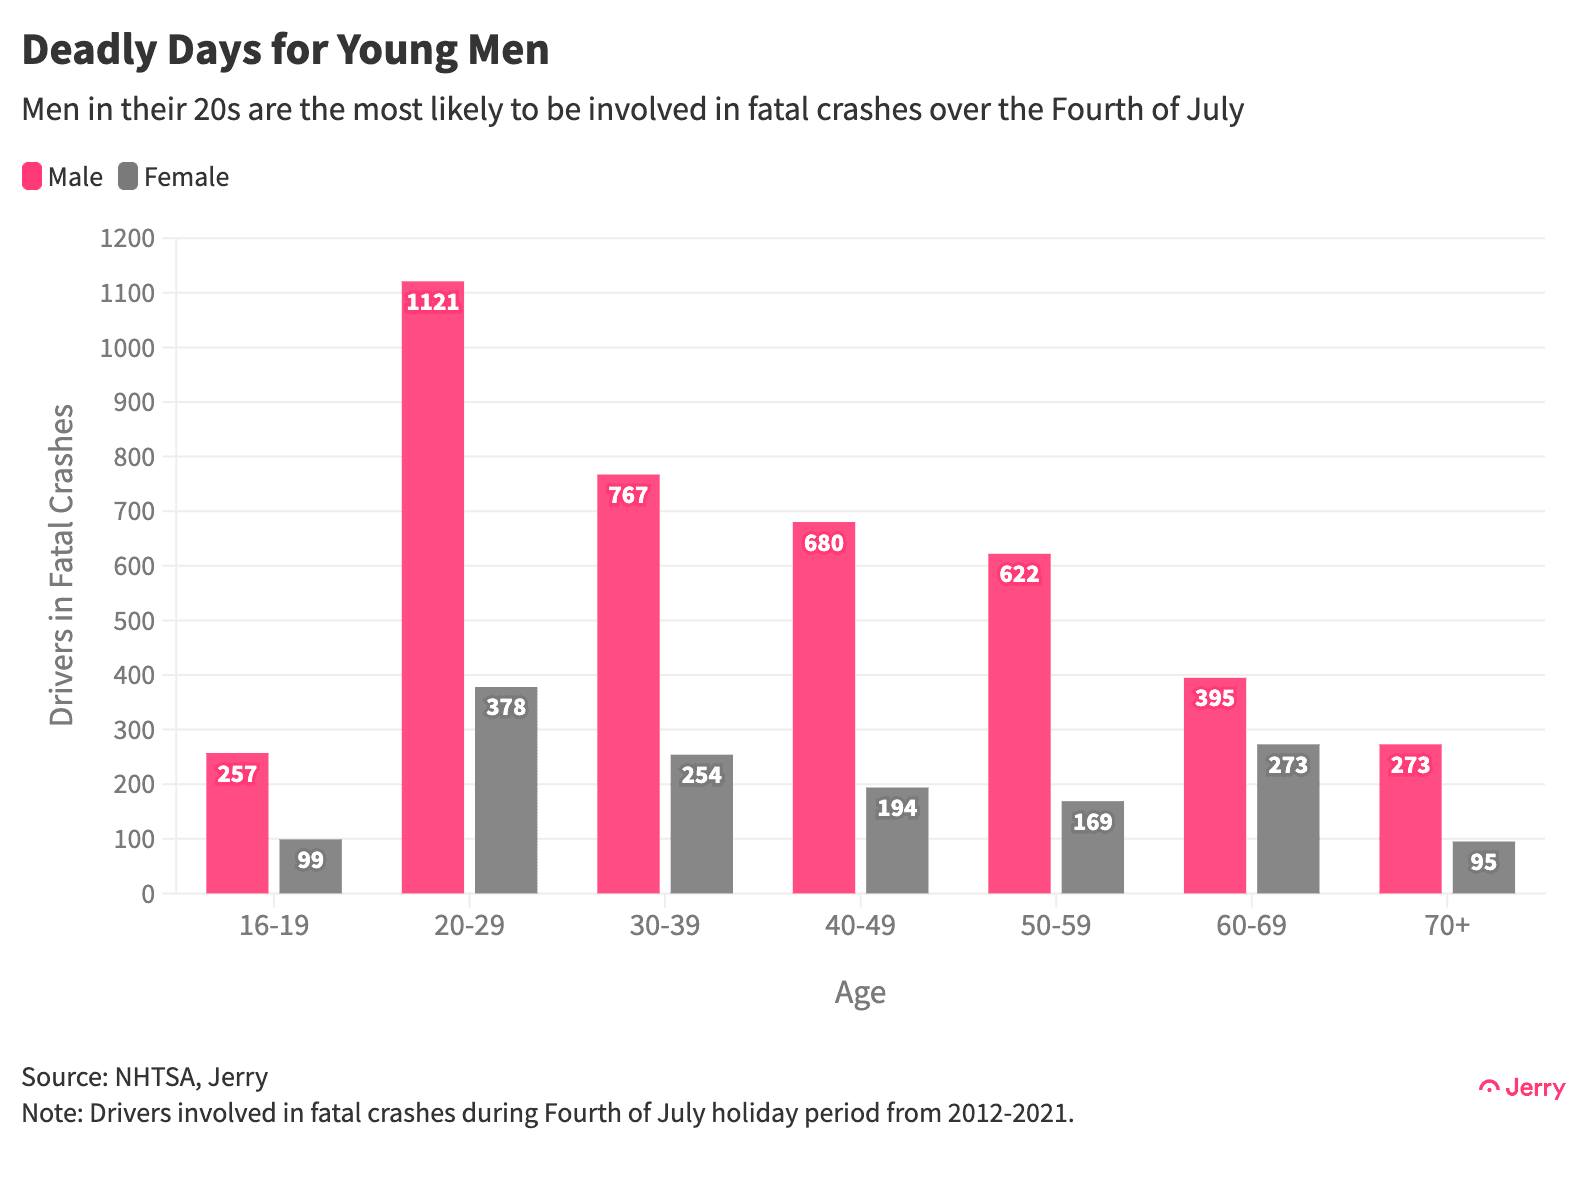
Drivers in their 20s were behind the wheel during fatal Fourth of July crashes more frequently than any other age group, accounting for 27% of all crashes from 2012 through 2021. Together, drivers in their 20s and 30s were behind the wheel in 45% of all fatal crashes.
An overwhelming majority (76%) of drivers involved in fatal crashes were male. Among males, those aged 20-39 were particularly overrepresented, accounting for 34% of all fatal crashes, versus 11% for females in the same age group.
Alcohol consumption and speeding are major contributors to fatal accidents during the Fourth of July holiday period. At least one driver had a positive blood alcohol test in 64% of fatal accidents in which a test was given. That means that at least 33% of fatal crashes involved at least one driver who had been drinking.
Nearly a third (31%) of all fatal crashes over the Fourth of July holiday involved speeding by at least one driver. At least half involved either speeding or alcohol use by at least one driver; at least 15% involved both speeding and alcohol use.
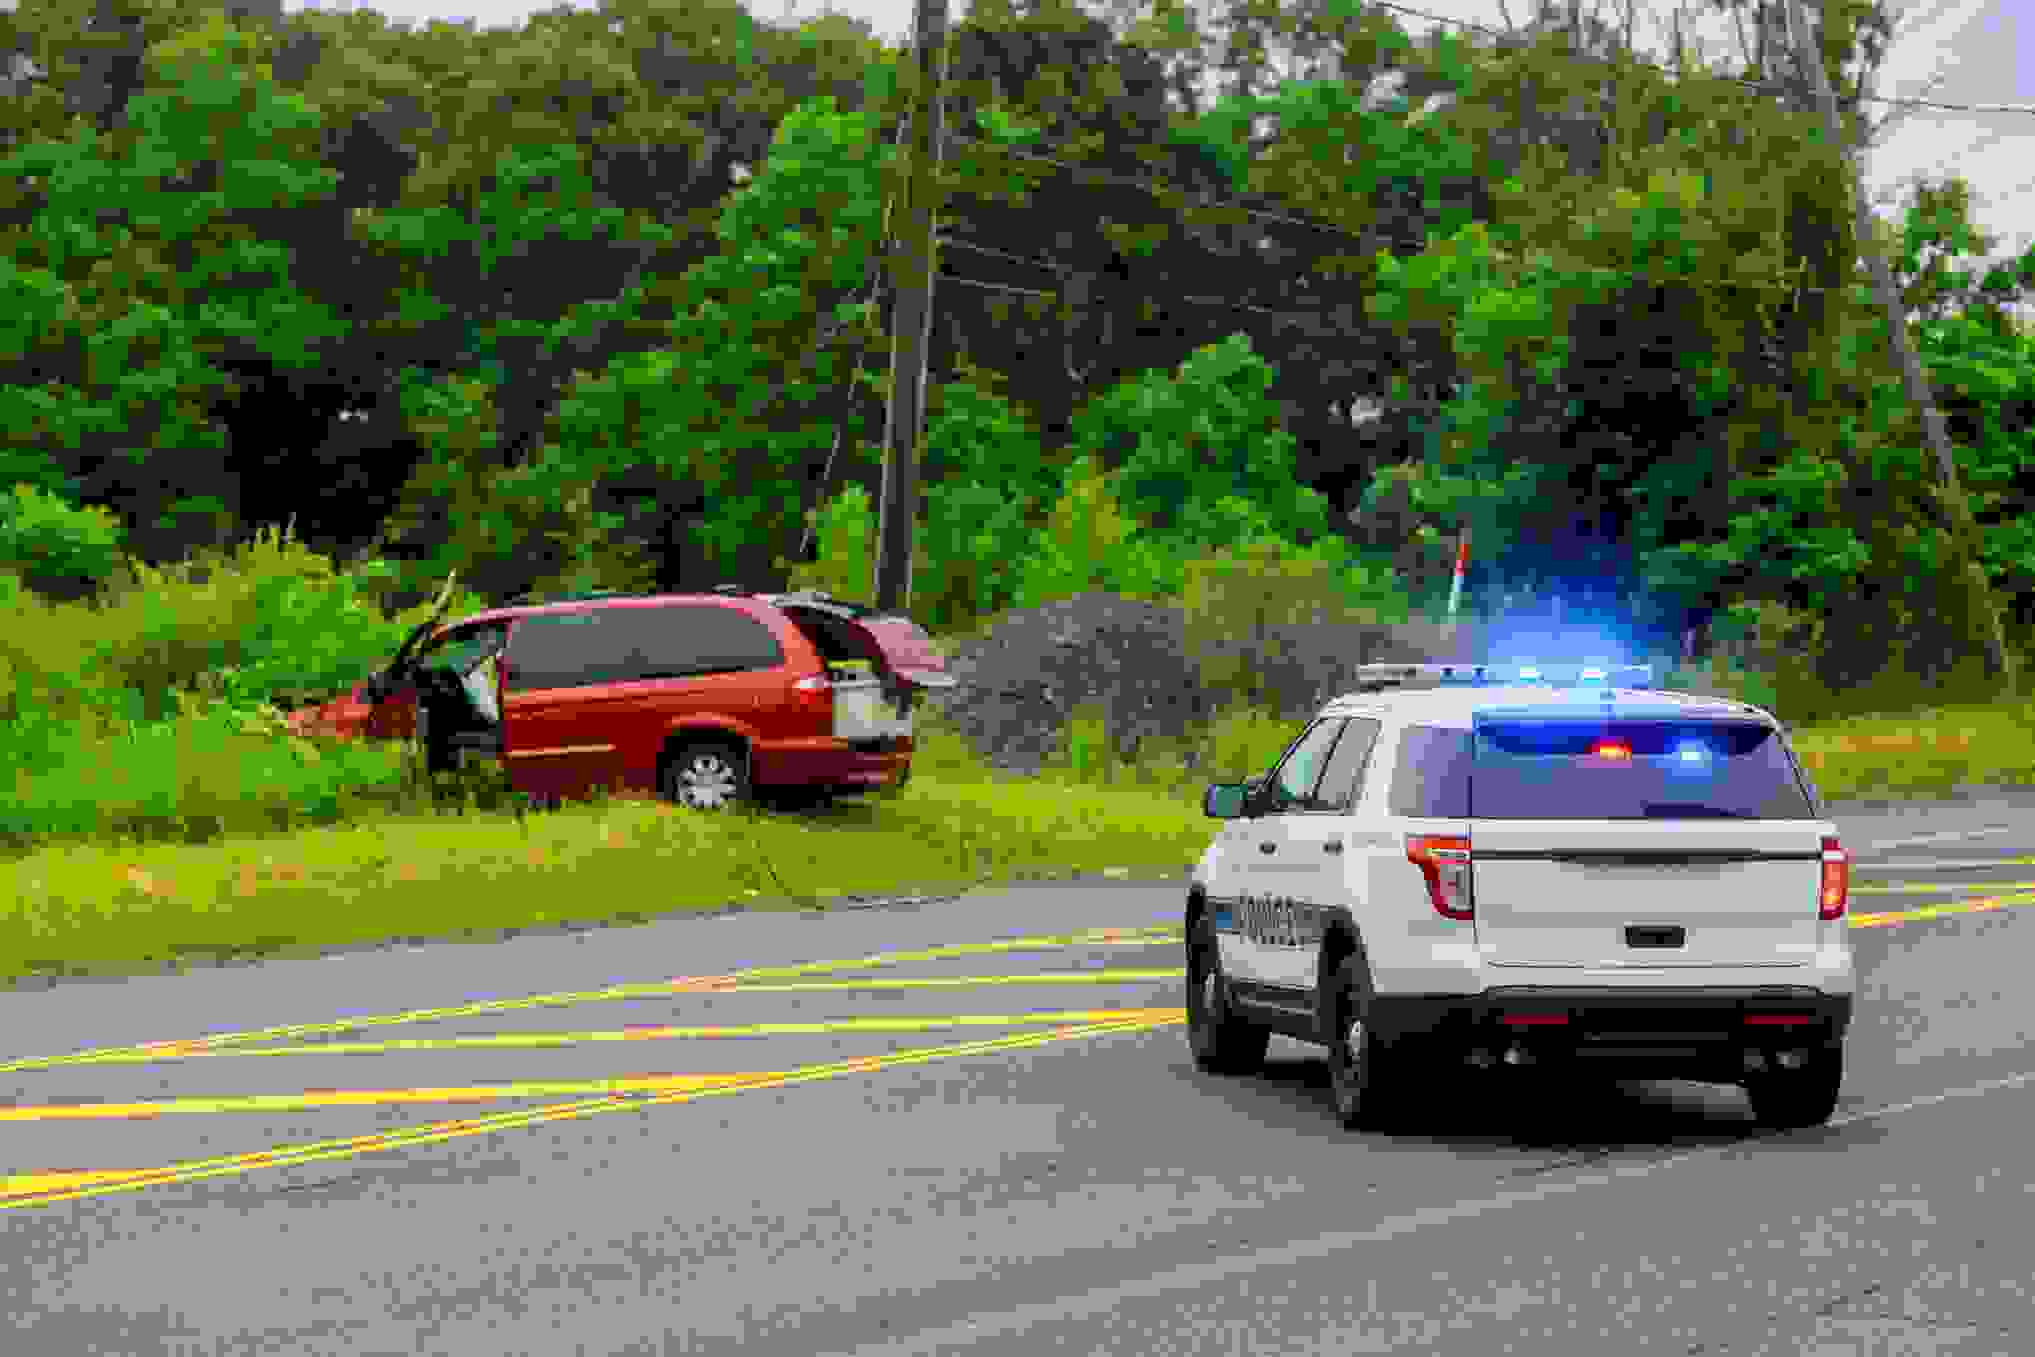
About half (49%) of all fatal crashes occurred in rural areas and 69% of crashes in rural areas involved a vehicle leaving the roadway.
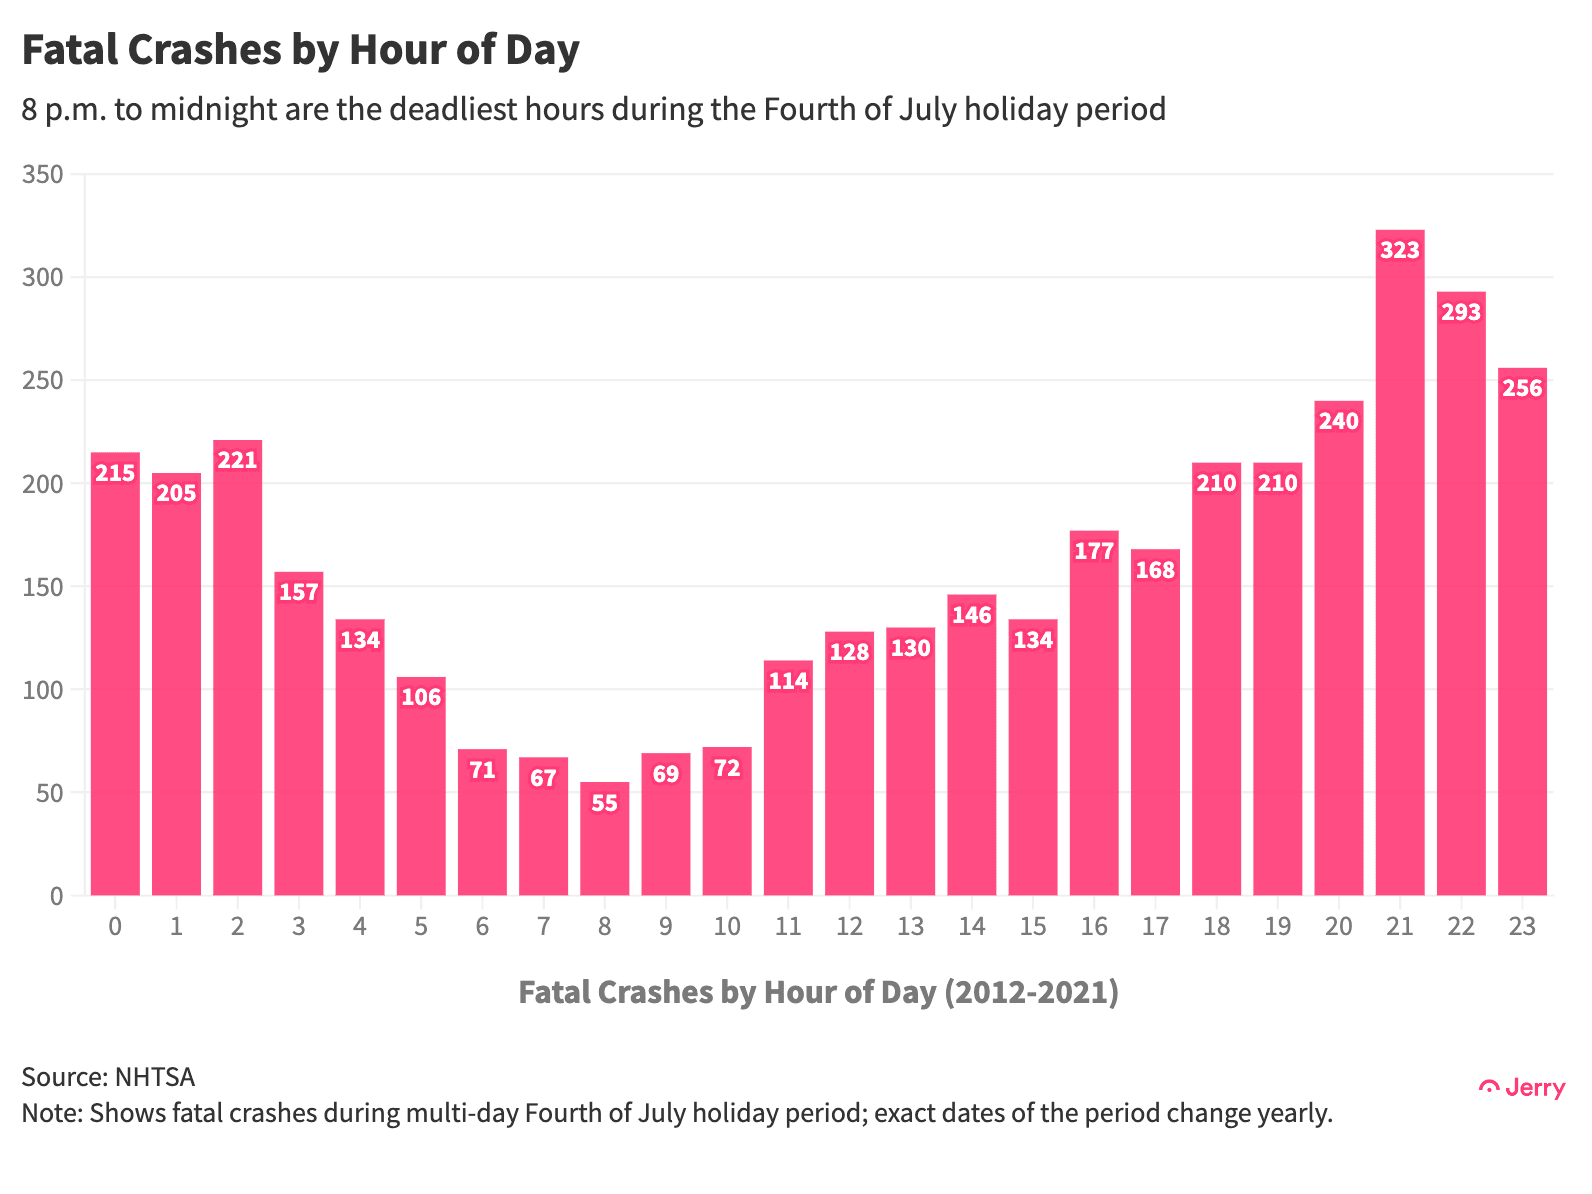
Certain hours during the Fourth of July holiday period see higher fatality rates than others. The hours between 8 p.m. and midnight are the four deadliest hours, regardless of day of week, with the 9-10 p.m. hour the worst. The hours between 6 a.m. and 10 a.m. see the fewest fatalities, with 8-9 a.m. the lowest overall.
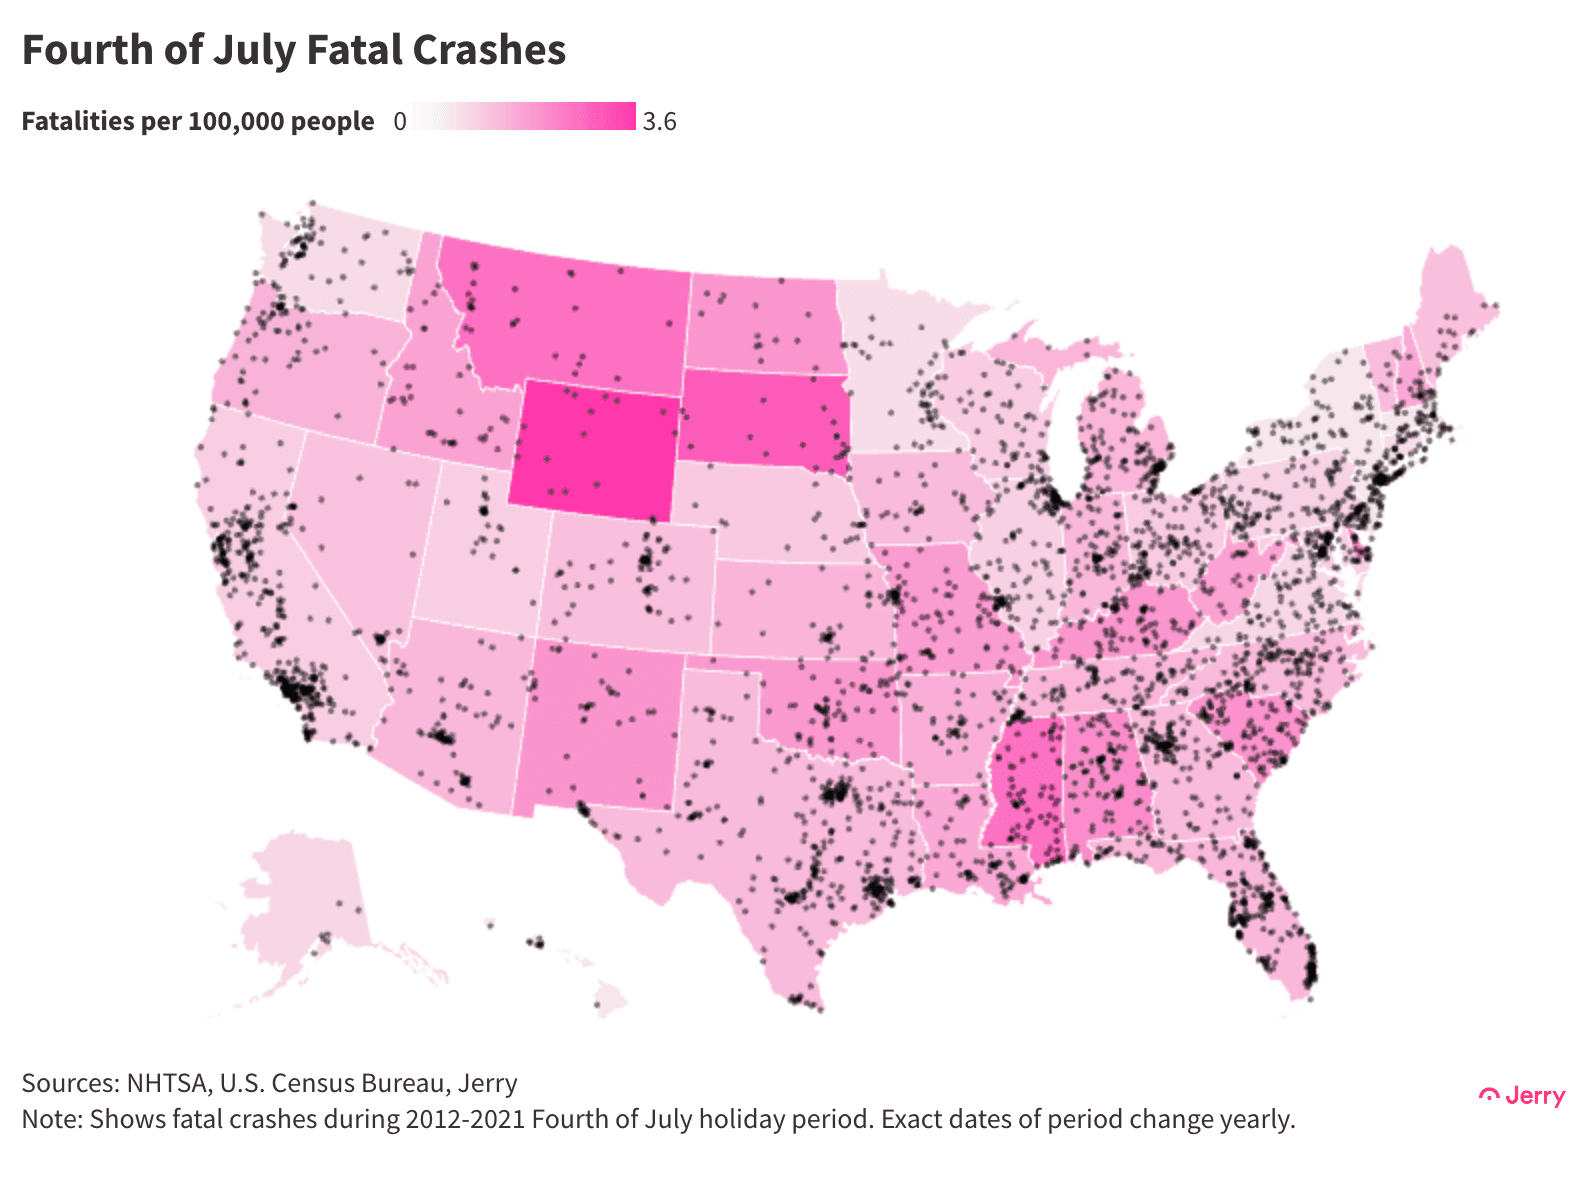
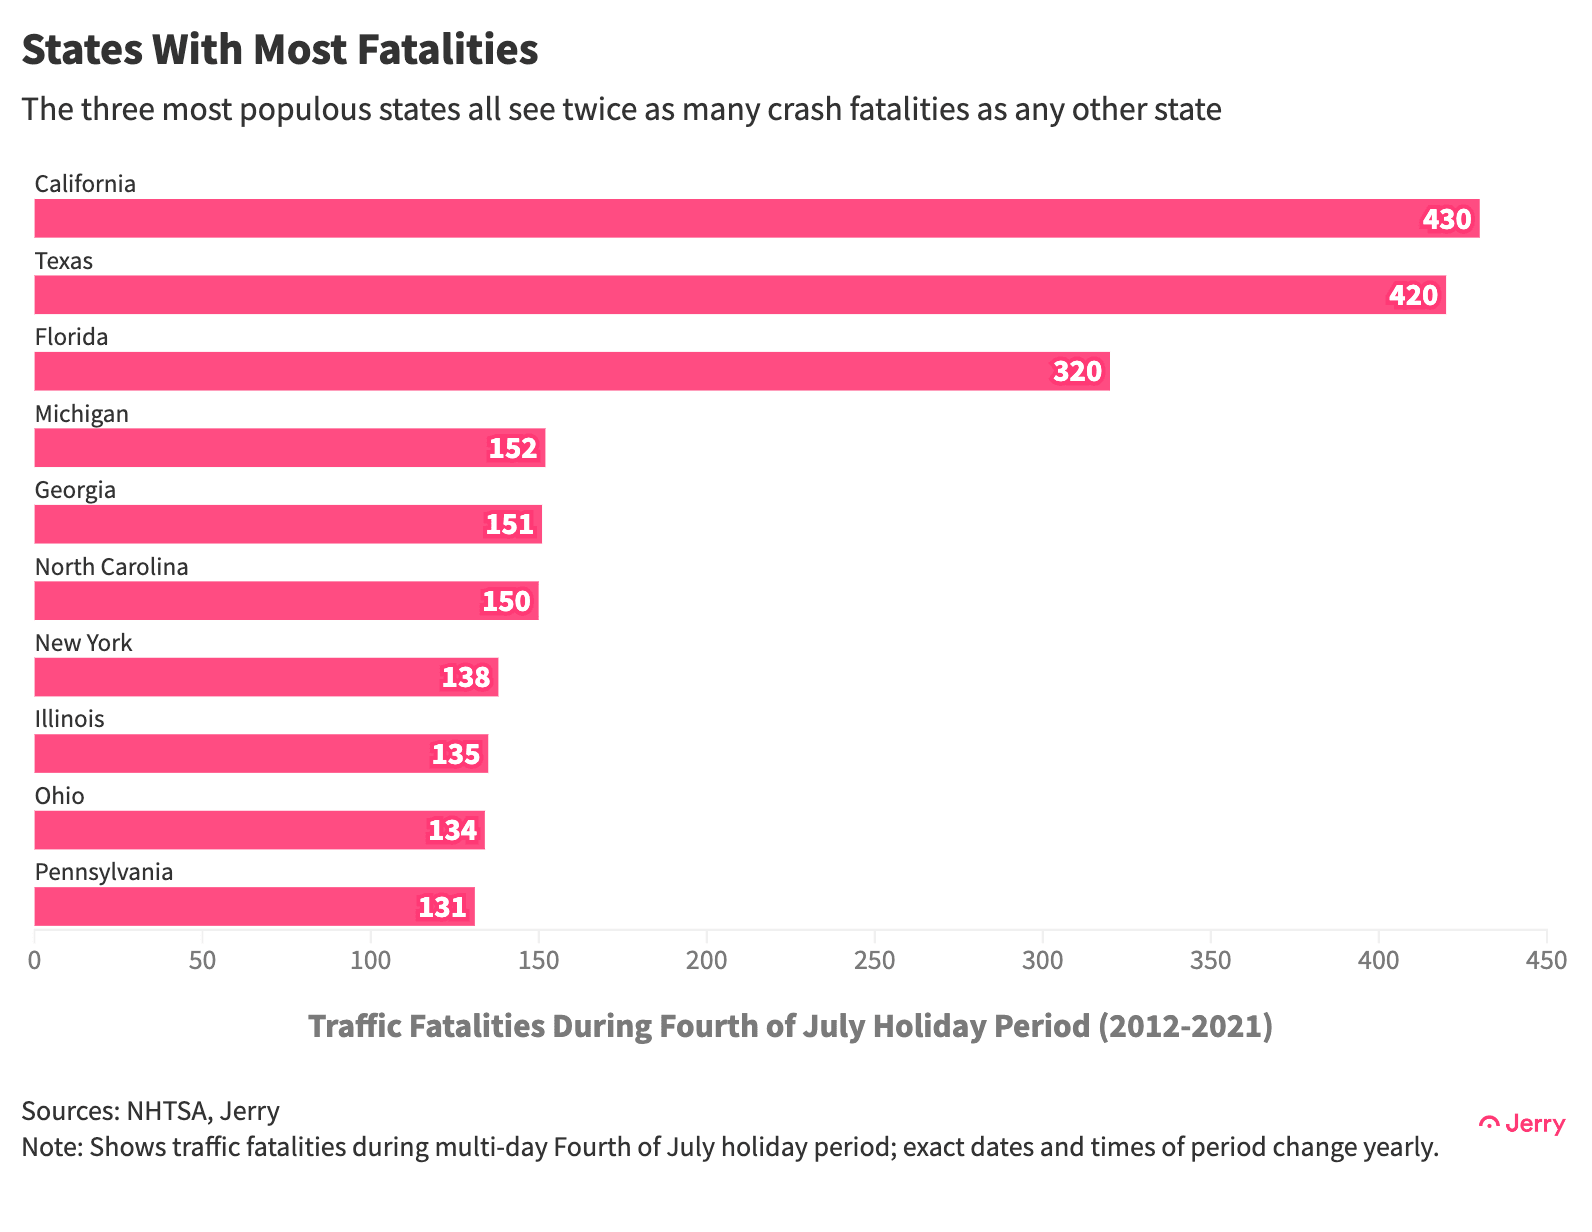
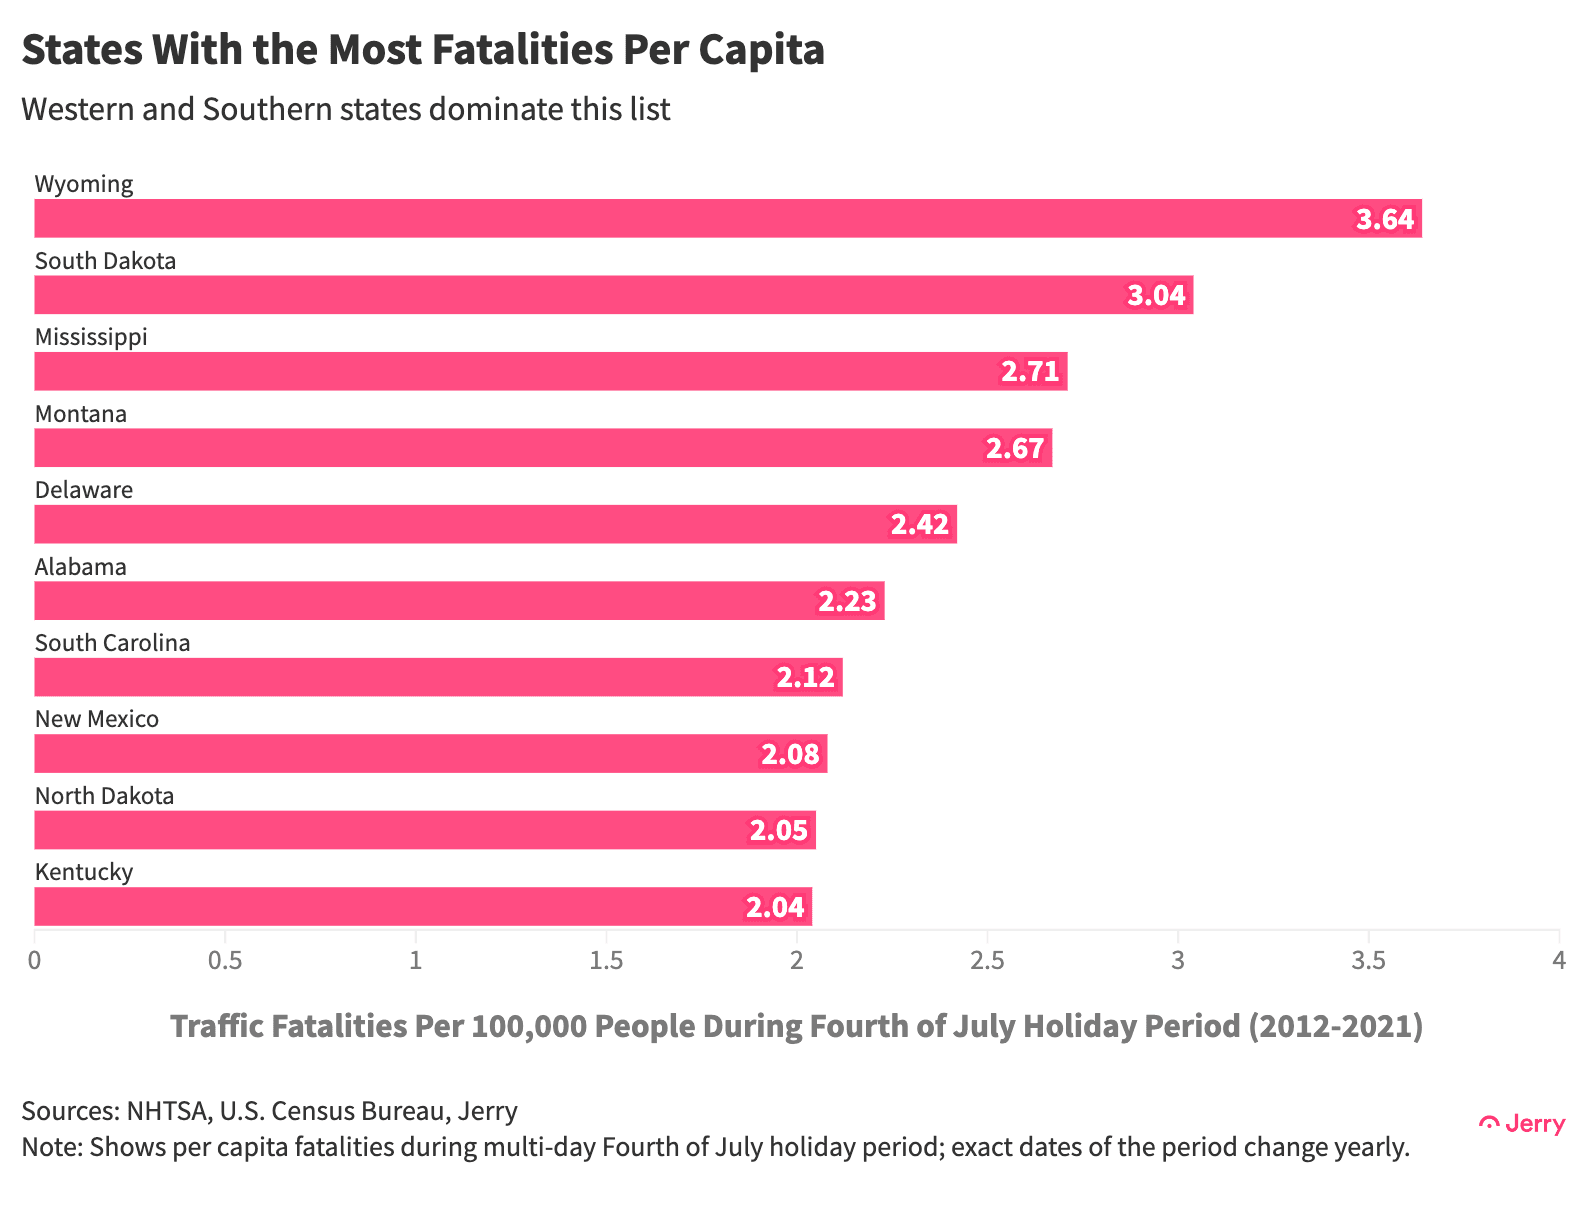
California, Texas and Florida are the states with the most fatal crashes overall, while Wyoming, South Dakota and Mississippi saw the most per capita.
The single most common age of drivers involved in deadly Fourth of July crashes was 21. But they weren’t alone among their cohorts. Nine of the 10 most common ages of drivers involved in fatal crashes during the Fourth of July holiday period were 20-somethings—with the only exception being 20-year-olds, who ranked 11th.
Alcohol was a factor in about three quarters of fatal crashes in which the driver was in their 20s (75%) or 30s (74%) and a blood-alcohol test was conducted. That compares to 60% for all other age groups.
Similarly, there was at least one 20-something driver behind the wheel in 37% of all accidents in which both alcohol and speed played a role. And 83% of those drivers were male.
Given that at least 31% of all Fourth of July fatal crashes involved at least one driver who was drinking, it’s little surprise that the deadliest hours were also prime drinking hours for young people: 8 p.m. to midnight, with only a modest dropoff from midnight to 3 a.m.
It’s also little surprise that the 10 most populous U.S. states rank as the 10 states with the most overall Fourth of July holiday traffic fatalities. None of those 10 states rank among the top 20 states in fatalities per capita. In fact, three of them (New York, Pennsylvania and Illinois) rank in the bottom 10, with New York third from last. California ranks 37th.
An entirely different list of states pops up when looking at fatal crashes per capita and it’s dominated by sparsely populated, rural states in the South and West. Wyoming, the second most sparsely populated state after Alaska, sees the most Fourth of July holiday traffic fatalities per capita.
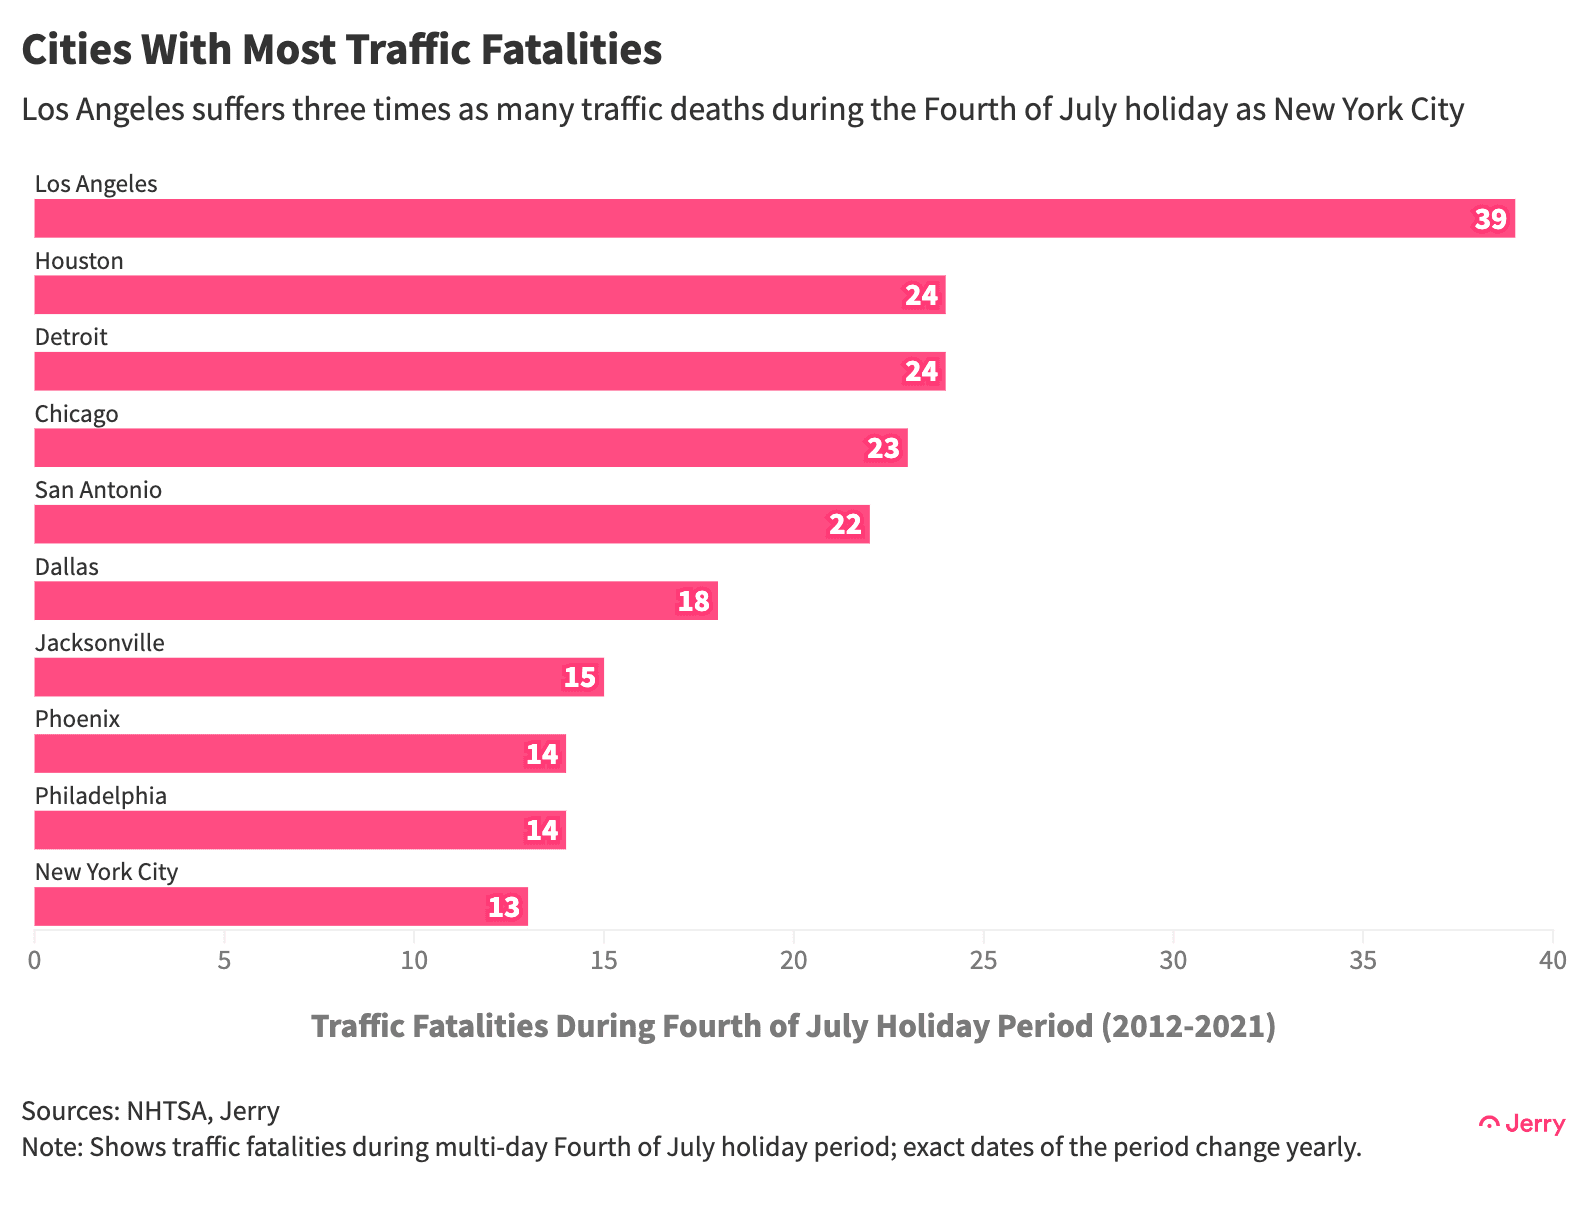
Los Angeles stands out as the city with the most fatalities, by a wide margin. Los Angeles sees more than three times as many as less-car-centric New York City but also more than 50% more than Houston, Detroit and Chicago. Three cities in Texas make the list.
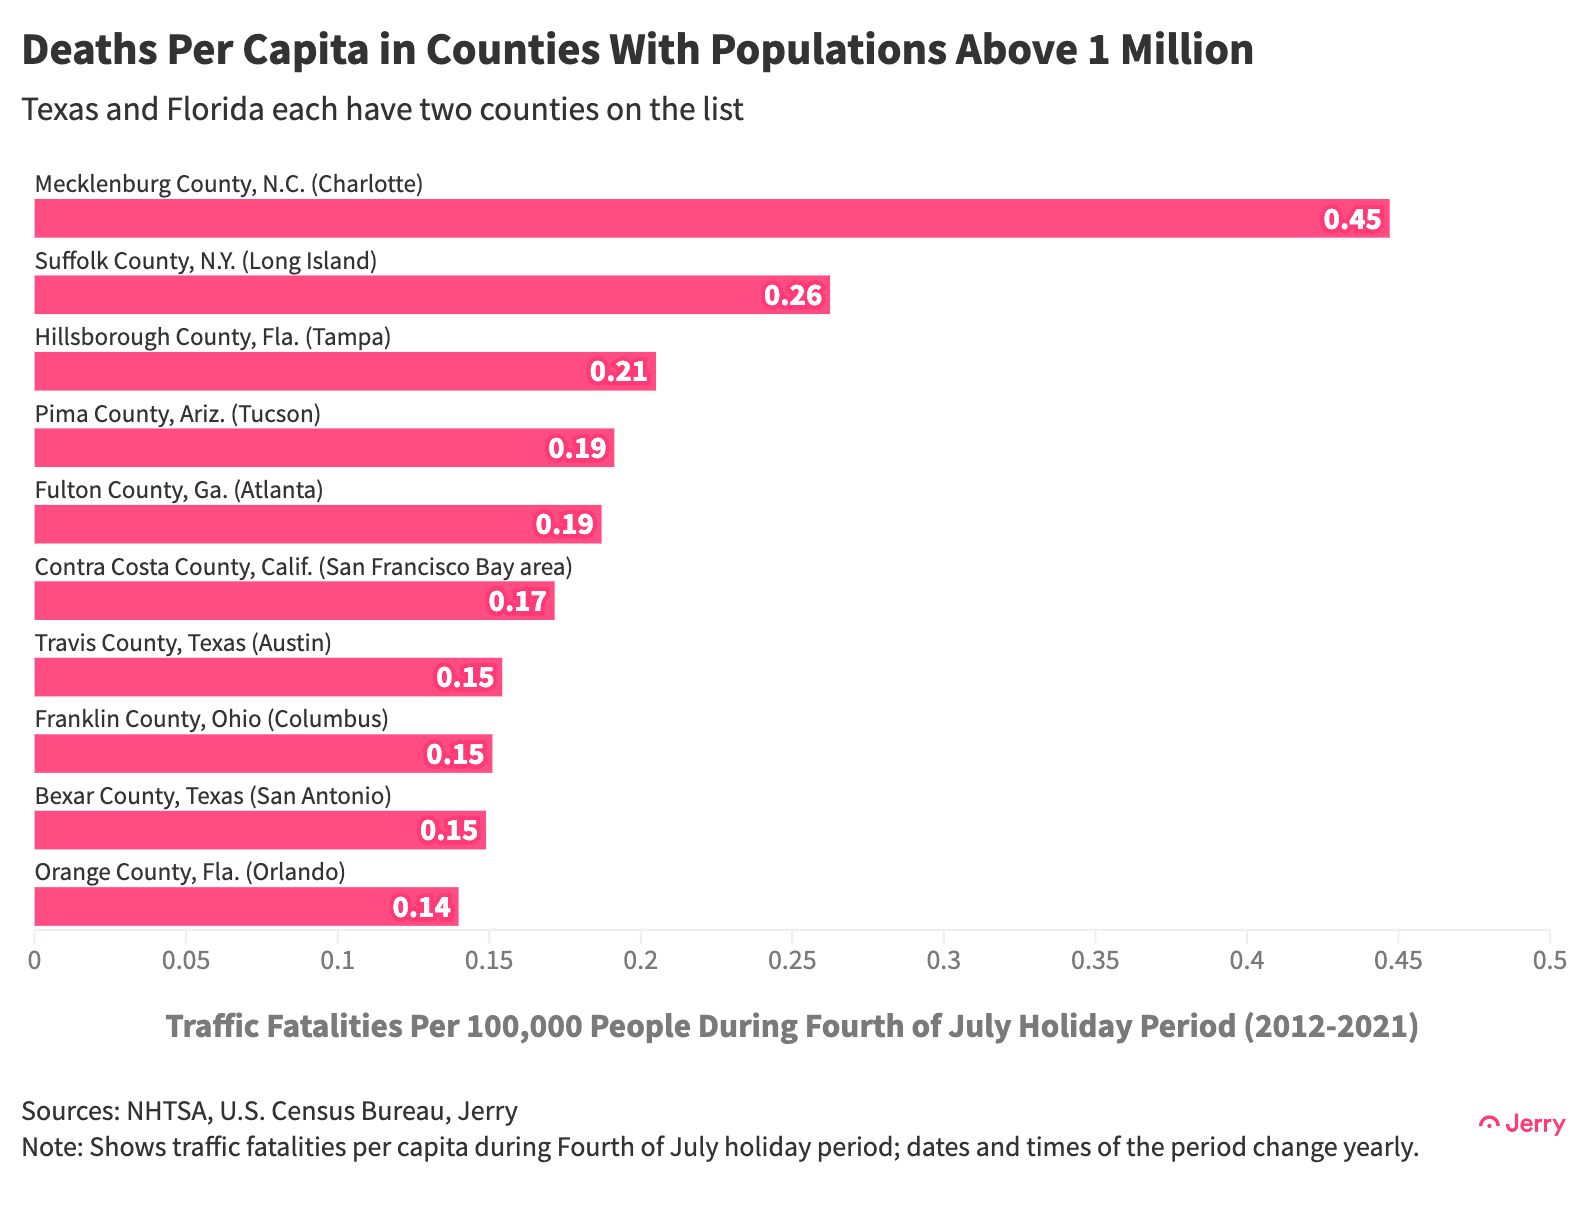
As a proxy for urban areas not contained within city limits, we took a look at per capita fatalities by county. Among large counties, with a population above 1 million, Mecklenburg, North Carolina, seat of Charlotte, has the highest fatality rate. Two counties in Texas and two in Florida made the list.
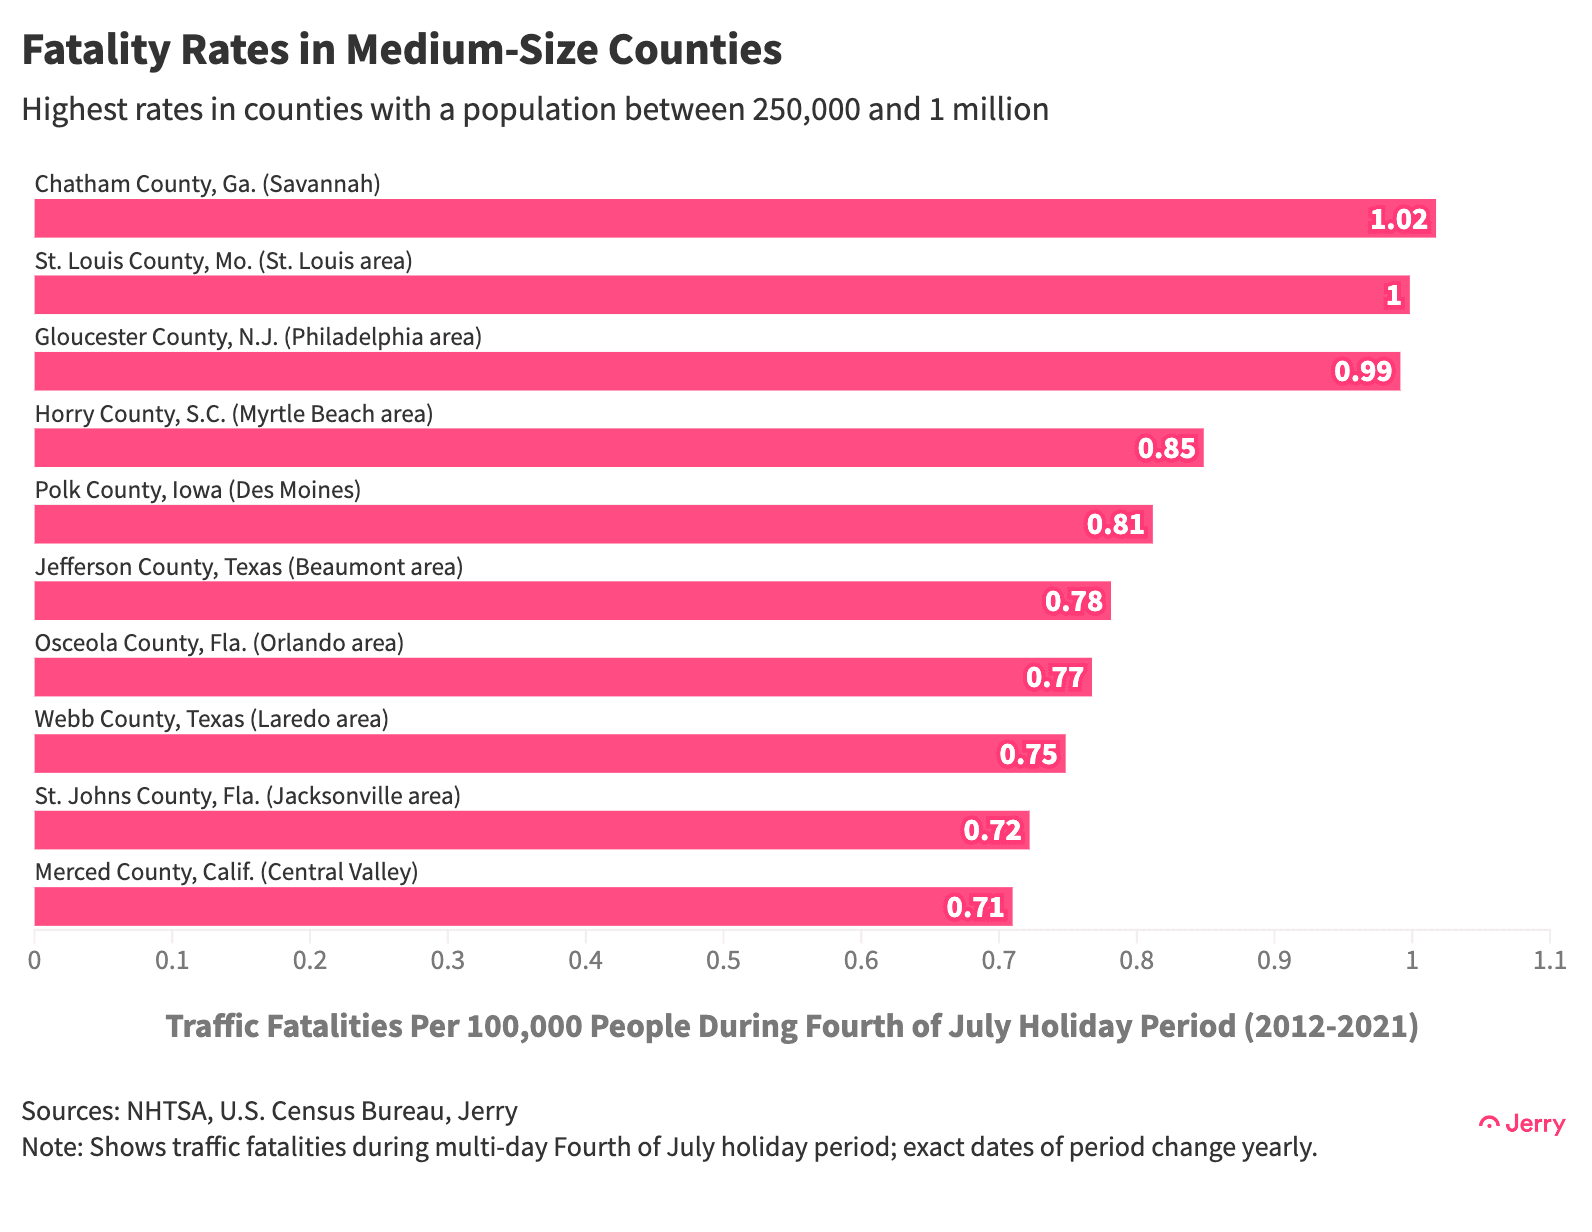
Chatham County, Georgia, which includes Savannah, has the highest fatality rate per capita among counties with a population of 250,000 to 1 million. It’s followed closely by St. Louis County in Missouri and Gloucester County, New Jersey, in the Philadelphia area. Again, two counties each in Texas and Florida made the list.
Methodology
Jerry used traffic fatality data from the National Highway Traffic Safety Administration for the years 2012-2021 and population data from the U.S. Census Bureau. The NHTSA defines the Fourth of July holiday period differently depending on which day of the week the holiday falls on. At its shortest, it starts at 6 p.m. on July 3 and ends at 6 a.m. on July 5.
For the purposes of this study, alcohol involvement means alcohol was found in the bloodstream of at least one driver. A blood-alcohol test was conducted in about half of the fatal crashes.