People choose a brand — whether of a car, clothing, or smartphone — because of what they think it says about them. So perhaps a little brand snobbery is only natural.
It’s no secret that many iPhone devotees look down at their Android-carrying fellow humans. Many iPhone users, who are younger and make more money, don’t want to date Android users, and some say they wouldn’t even message someone who didn’t have an iPhone.
Android users, on the other hand, have been found to be more open, honest, and humble — and less interested in luxuries and social status. If they were the type to do so, they could also brag about being safer drivers.
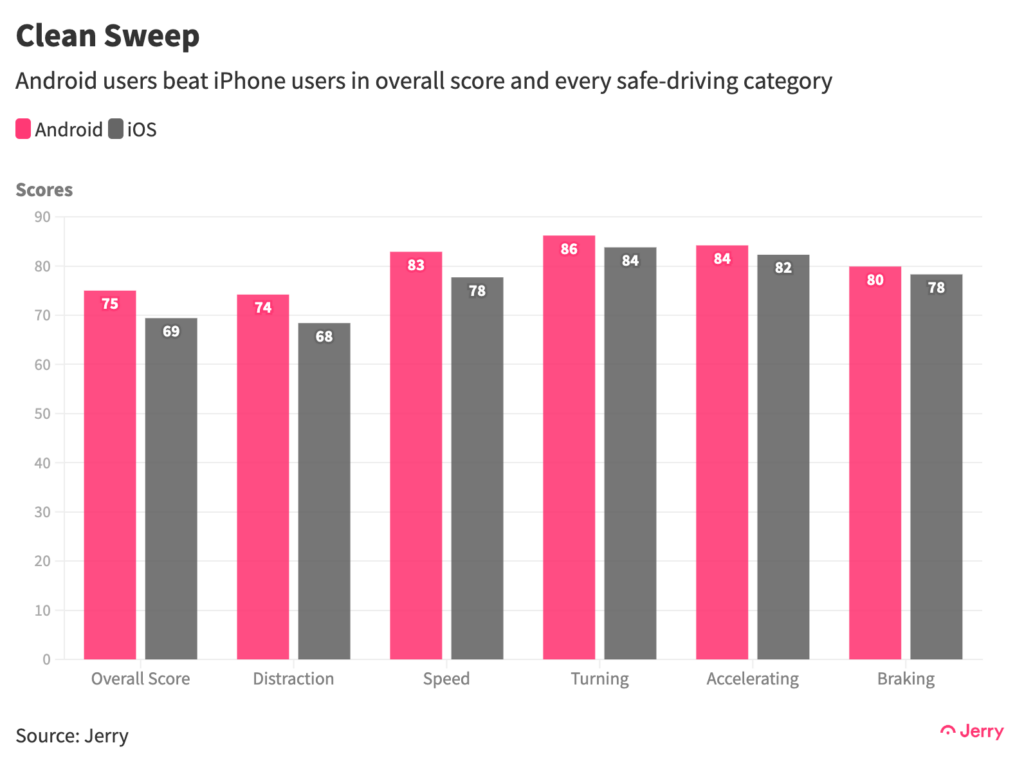
Jerry analyzed driving behavior of 20,000 drivers collected during 13 million kilometers of driving, and the results were clear: When it comes to safe driving, Android users outperformed their iPhone-carrying counterparts at every turn and stoplight.
Key Insights
Android users achieved higher safe-driving scores than iPhone users in every single category: overall safe driving, speeding, distraction, turning, braking, and accelerating.
The widest margin was in the distraction category, meaning Android users most outperformed iPhone users at keeping their hands off their phones while driving.
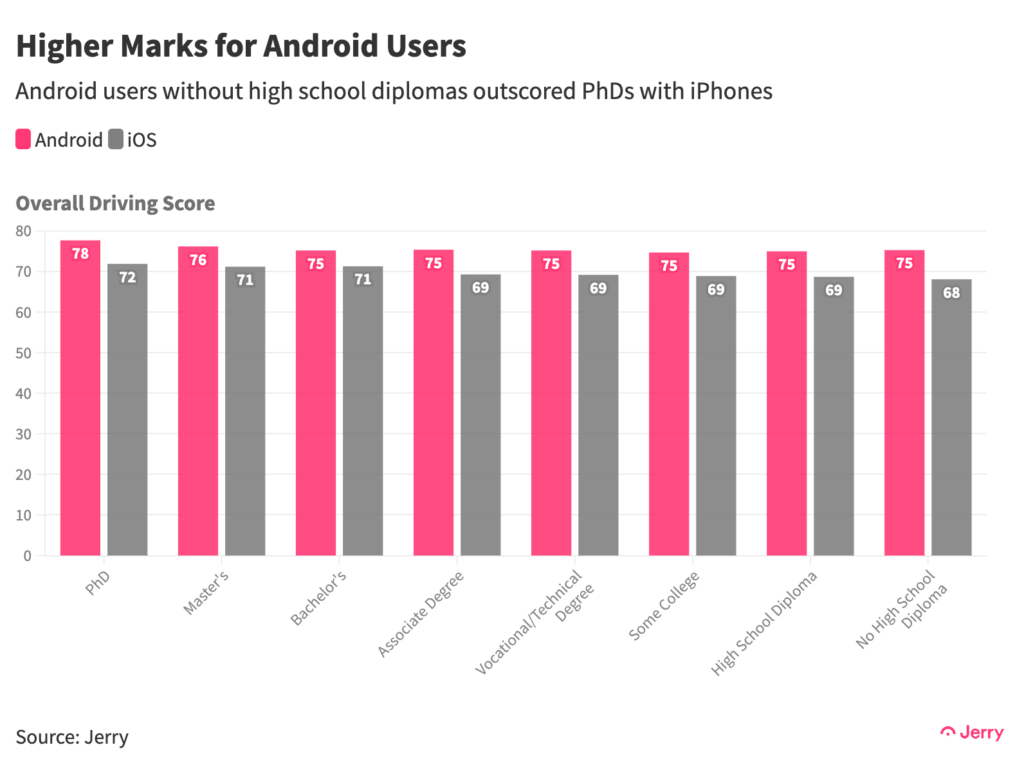
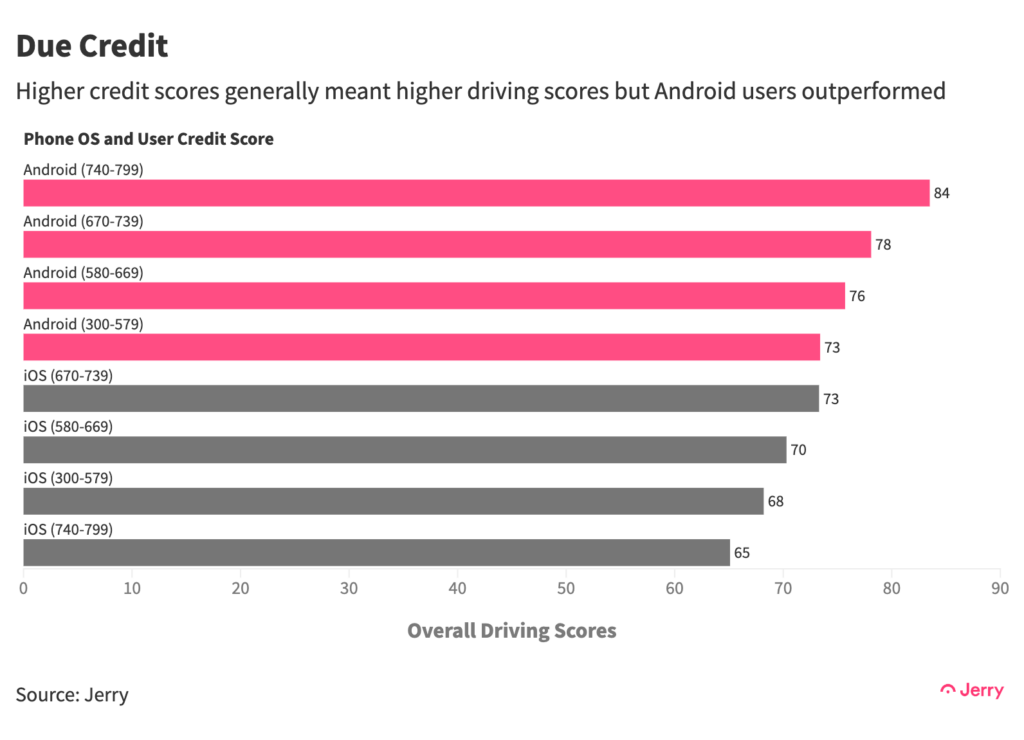
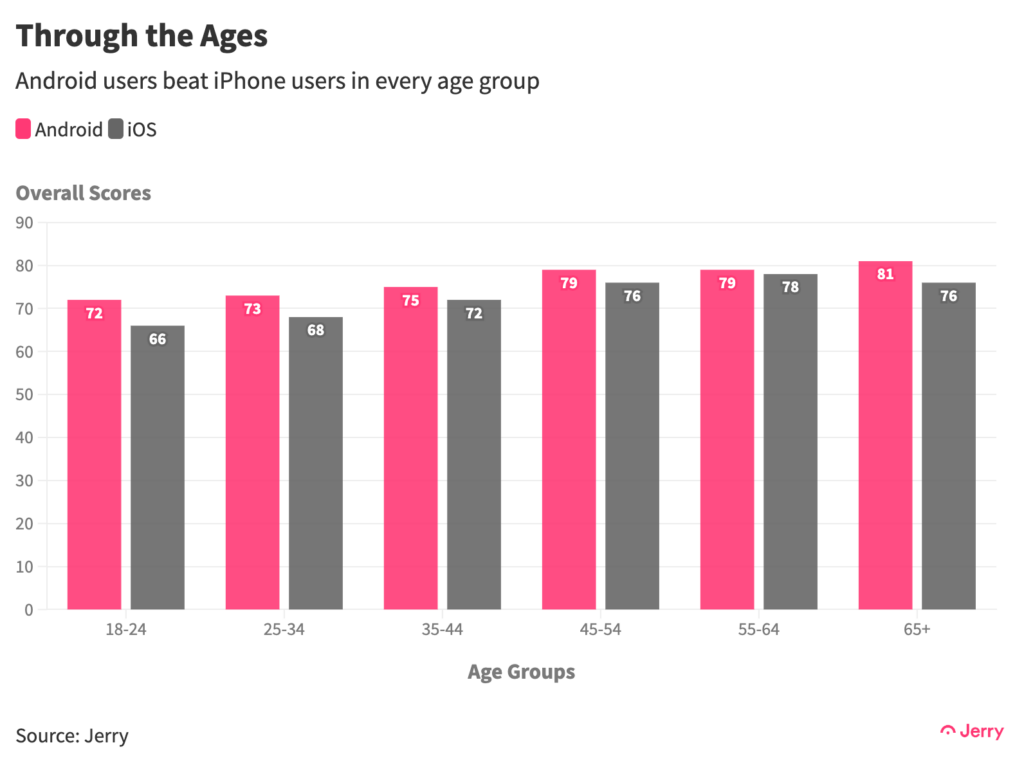
Android users achieved higher scores regardless of age, gender, marital status, education, and credit rating — characteristics that otherwise are strong predictors of safe-driving scores.

Putting aside preferred smartphone operating systems, older people who are married, homeowners, who live in the Midwest, have bachelor’s or more advanced degrees, and higher credit ratings scored highest overall. This also held true for Android and iOS users separately.
But when broken down by these characteristics, Android users outperformed every time, often in a way that ran counter to the factors driving higher scores overall. Single Android users, for example, beat married iPhone users, and Android-using non-homeowners beat iPhone-carrying homeowners, and so on.
Take education. Overall, whether they owned an iPhone or an Android device, PhDs earned the highest scores, followed by those with master’s and bachelor’s degrees, respectively. Yet Android users without a high school diploma scored higher than iPhone devotees with PhDs, master’s and bachelor’s degrees.

The same holds true for credit ratings. While scores closely tracked credit ratings, Android devotees in the lowest credit score bracket outperformed even iPhone users in the highest bracket.

Choice of smartphone clearly distinguished drivers among men and women too. All else being equal, men and women received identical overall scores (71). But factor in smartphone choice and the story changes, with Android-using men and women outperforming their counterparts 75 to 70 and 75 to 69, respectively.
Rule Followers vs Emotional Drivers?
So what accounts for the starkly different scores for the two groups? Well, it’s not clear from the data itself. The biggest gap in scores was found in the distraction category — a measure of how often a driver handles their smartphone while driving. In other words, iPhone users have a harder time leaving their phones alone while behind the wheel. But that wouldn’t explain Android users’ higher scores across all categories and demographic characteristics.
iPhone users are younger than Android users, and age is a strong predictor of safe driving, given young people’s bigger appetites for risk. But Android users of every age group outscored their same-age counterparts and even some older iPhone users.

Perhaps clues can be found in personality studies of the two groups. One study found that Android fans were more conscientious, while another found they exhibited higher levels of honesty and “feel little temptation to break the rules.” iPhone users, on the other hand, showed higher levels of emotionality, meaning they are less consistent and predictable in their behavior. Maybe that translates into sharper acceleration, braking, turning, and higher speeds — all behaviors that would drag down a person’s score.
Whatever the reasons, Android users clearly come out ahead. Safe driving habits tend to correlate not just with a lower risk of accidents, but with lower car insurance premiums and improved financial security.
Methodology
Jerry analyzed data collected from 20,000 drivers during 13 million kilometers of driving over a 14-day period. The data generated an overall driving score as well as sub-scores for acceleration, speed, braking, turning, and distraction. Then we grouped the results by smartphone operating system and various demographic characteristics.
Note: There were twice as many iPhone users in the dataset as Android users. So that means when we say, for example, that homeowners outperformed non-homeowners generally, while Android-using non-homeowners outperformed iPhone homeowners, those baseline results weren’t due to an outsized number of high-performing Android users determining the overall scores.

Henry Hoenig previously worked as an economics editor for Bloomberg News and a senior news editor for The Wall Street Journal. His data journalism at Jerry has been featured in outlets including CBS News, Yahoo! Finance, FOX Business, Business Insider, Bankrate, The Motley Fool, AutoWeek, Money.com and more.


