In this age of polarization, American drivers are united behind at least one cause: spending more tax dollars to improve their driving experience.
In a recent survey by Jerry, 84% of drivers said the government should spend more money on the nation’s roads and bridges.
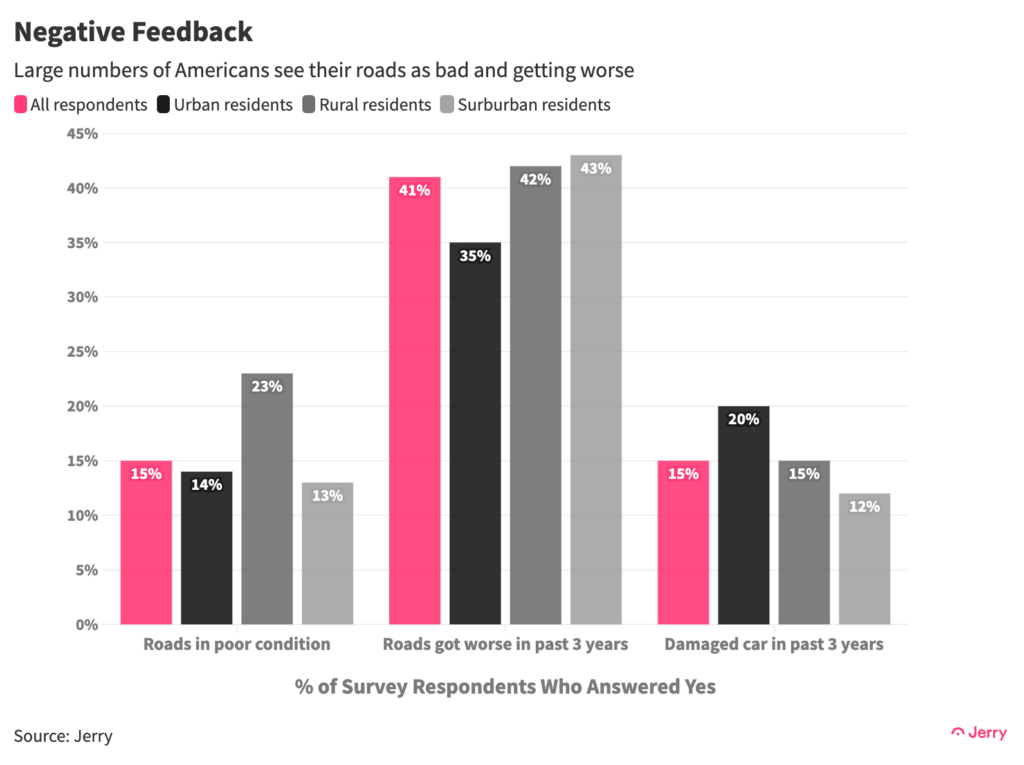
Drivers hold unfavorable views of the transportation infrastructure. Fewer than half (44%) said they think the roads in their area are in good shape, and 15% said they were in poor condition. Forty-one percent say they’ve gotten worse in the past three years, twice as many as the 19% who say they’ve gotten better.
Official data backs them up. According to the Department of Transportation (DOT), only 44% of the nation’s roadway miles were in “good condition” in 2022. Another 37% were in “fair” condition and 19% in “poor” condition.
Bridges got a similar report card. In 2023, 44% of the country’s bridges were in good condition. Another 43% were considered in fair condition and 9.4% in poor condition.
Key Insights
- Fewer than half (44%) of Americans surveyed by Jerry think the roads in their area are in good condition, with 15% describing them as “poor or very poor.” Only 19% say they’ve gotten better in the past three years, while 41% say they’ve gotten worse.
- Nearly one in five (18%) residents of rural areas said the roads in their area are in poor condition, compared with 12% of urban residents and 11% of people who live in suburban areas.
- Fifteen percent of American drivers—and 20% of those who live in urban areas—say they have been involved in an accident or suffered damage to their vehicle at least once during the past three years because of bad road conditions such as potholes, flooding or debris.
- Nearly half (47%) of those involved in an accident or suffering vehicle damage due to bad roads spent more than $500 on related repairs, while nearly one in five (19%) spent more than $1,000.
- The vast majority of all motorists (84%) agree or strongly agree with the statement, “The government should spend more money on roads and bridges.”
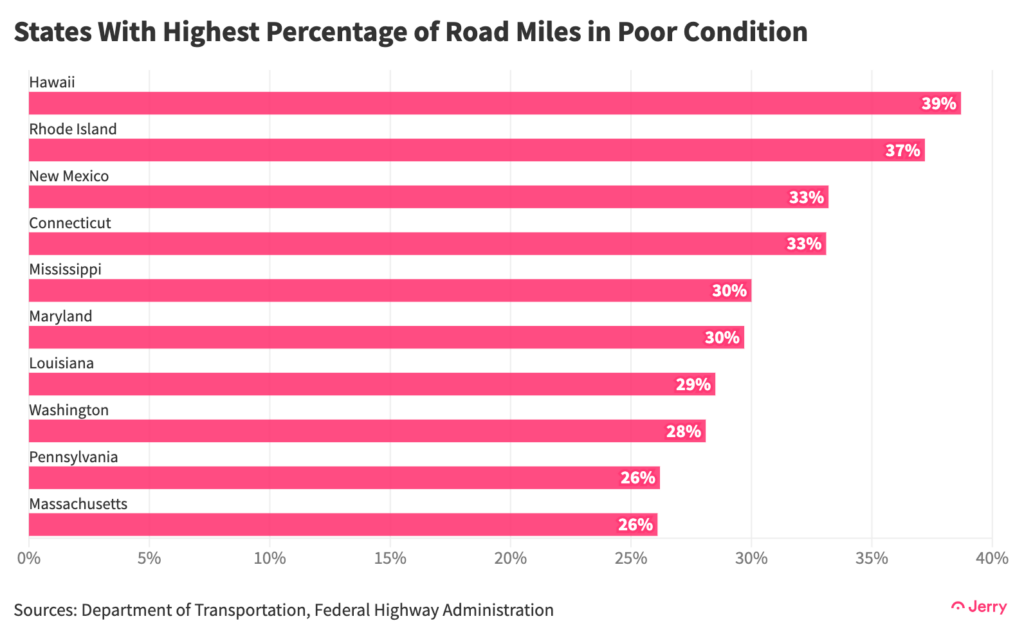
- Hawaii, Rhode Island, and New Mexico have the highest percentages of roadway miles in poor shape.
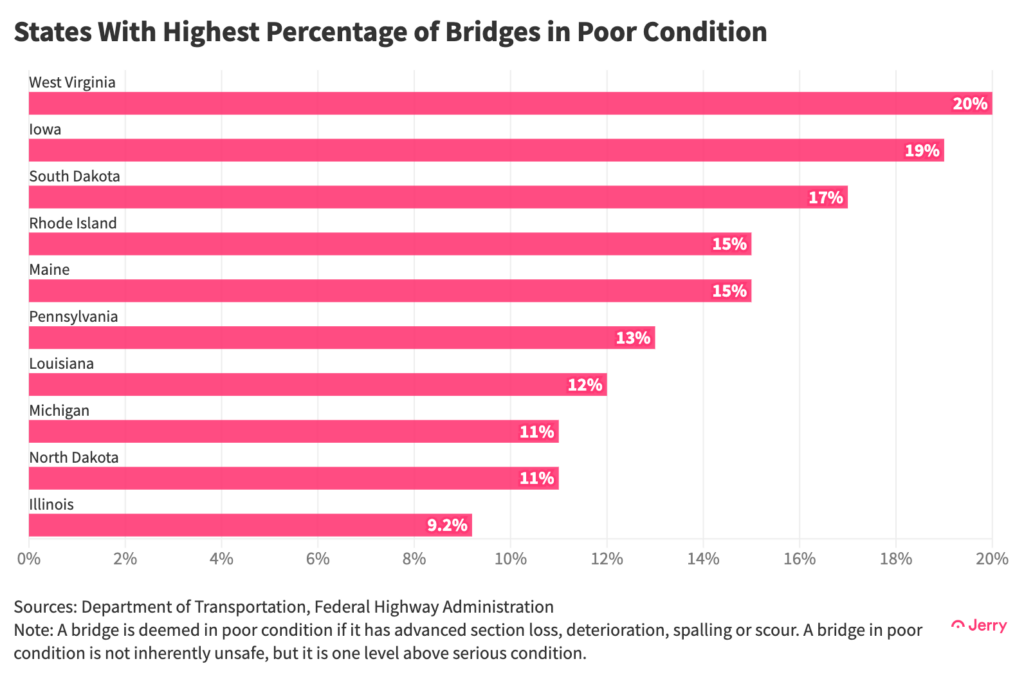
- West Virginia, Iowa and South Dakota have the highest percentage of bridges in poor condition.
- As a share of gross domestic product, spending on highways is at about half the level it was in the 1960s, according to the Congressional Budget Office. State and local governments spent more than three times as much as the federal government on highways in 2022.
- Forty-two percent of all bridges in the U.S. are at least 50 years old, and 7.5% are considered structurally deficient, according to the American Society of Civil Engineer’s 2021 Infrastructure Report Card, which drew on DOT data.
Location Matters
To a degree, conditions depend on where you live. Survey respondents who said they live in suburban areas were slightly more likely than others to describe the roads in their area as good. Yet 10% of residents of urban areas described their roads as excellent—about twice as many as suburbanites (5.3%) and about five times as many as those who live in rural areas (2.1%).
Residents of rural areas were more likely to describe roads in their area as poor (18%) or very poor (4.6%). Only 11% of people who live in suburban areas said their roads were poor, while 12% of urban residents said so.
People who live in urban areas were most likely to say their roads improved in the previous three years and least likely to say they deteriorated. Suburbanites, on the other hand, were least likely to say they improved and most likely to say they got worse.

Drivers also said bad roads were costing them money. In the past three years, 15% have been involved in an accident or suffered damage to their vehicle because of poor road conditions such as potholes, flooding or debris in the roadway.
Curiously, 20% of urban residents, who were more likely to say their roads were in good condition, said they had been involved in an accident or suffered vehicle damage due to bad roads. That compares to 15% of rural residents and 12% of suburbanites.
Nearly half (47%) of respondents whose vehicle was damaged or were involved in an accident due to bad roads spent more than $500 on related repairs, while nearly one in five (19%) spent more than $1,000.
Suburban residents and, to a lesser degree, people who live in rural areas were more likely to face a repair bill above $1,000 than those who live in urban areas. One quarter (25%) of people who live in suburban areas report paying over $1,000 due to poor road conditions in the past three years, versus 13% of urban dwellers and 17% of those who live in rural areas.
State Rankings
Road conditions vary widely by state. At least a third of roadway miles are in poor condition in the four states with the highest percentage of miles in poor condition: Hawaii, Rhode Island, New Mexico, and Connecticut. By contrast, only 1.7% of roadway miles are in poor condition in Alabama, the state with the lowest percentage, and 3% in second-ranked Indiana.

It’s a similar story when looking at bridges at the state level. One in five bridges in West Virginia is in poor condition, which is nearly 20 times higher than the 1.1% of bridges in Arizona that are.

Conclusion
The U.S. faces a widely recognized critical need for investment in transportation infrastructure and it’s only going to get worse.
The DOT estimates that it already faces an $800 billion backlog in investment in highways and bridges, including $479 billion in critical repair work. The Biden administration’s Infrastructure Act will allocate $317 billion over six years to federal highway programs, but that actually only adds $12 billion a year more than previously existing laws.
A 2021 study on the effects of climate change determined that higher temperatures would result in more road damage as well as increasing delays. By 2050, the damage to U.S. roads from climate change will cost $100 billion to $159 billion annually, depending on emissions levels, the study concluded.
More than 90% of those costs could be averted with proactive measures to make the nation’s roads more resilient, the authors of the study concluded. Otherwise, they said, most of those additional costs—at least $92 billion annually—will fall on motorists in the form of damaged vehicles and traffic delays.
Methodology
All survey data is based on a nationally representative survey of 1,300 respondents conducted in April 2024 using Pollfish. Respondents were filtered to include only those aged 18+ who own or lease a vehicle and drive at least once a week. More information about Pollfish and its audiences can be found on its website.
All data on the conditions of roads and bridges was taken from the Department of Transportation, except where attributed to other sources. Ratings for bridges were from 2023, while those for roads were from 2022.
Note that a bridge in poor condition is not necessarily unsafe. Poor condition is one level above “serious condition,” which may include problems with structural components, fatigue cracks in steel, or the failure of one structural element.

Henry Hoenig previously worked as an economics editor for Bloomberg News and a senior news editor for The Wall Street Journal. His data journalism at Jerry has been featured in outlets including CBS News, Yahoo! Finance, FOX Business, Business Insider, Bankrate, The Motley Fool, AutoWeek, Money.com and more.


