For most parents, how to pay for their children’s college education is a daunting question. Here’s another one: “How will we pay for our children to have a car to drive before they go?”
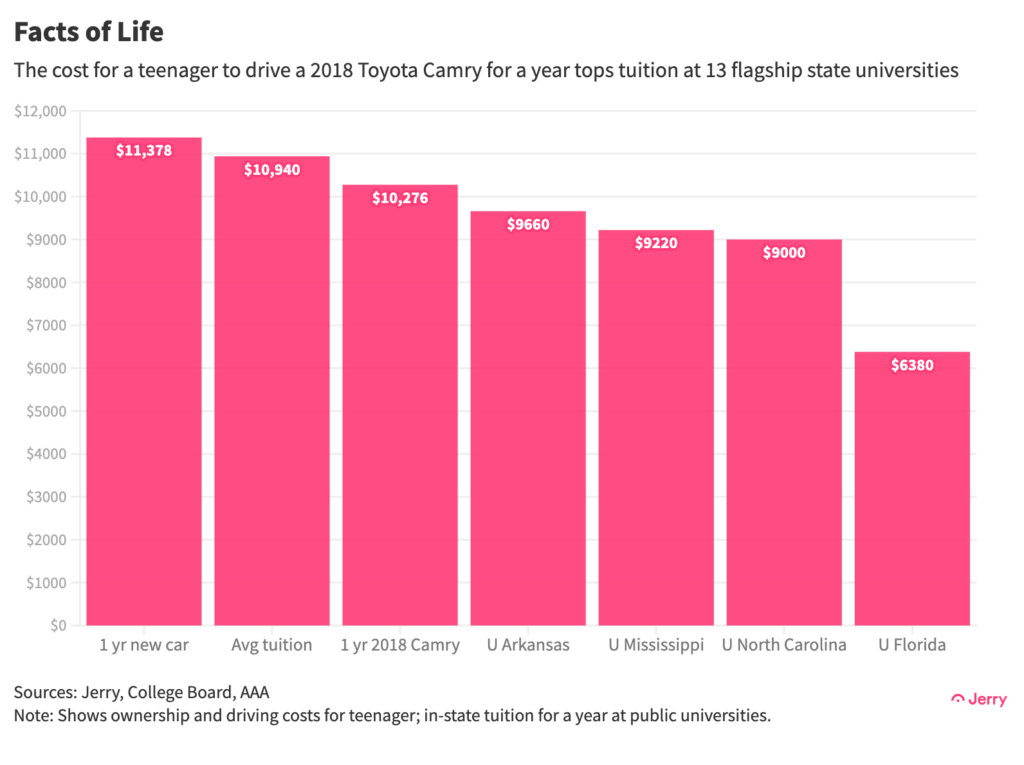
Owning a new car now costs more than in-state tuition at a public university. Of course, not every teen gets a new car. But even their annual cost to own a 5-year-old Toyota Camry ($10,276) exceeds in-state tuition at the flagship public university in 13 different states, and is just $664 less than the average for all four-year public universities.
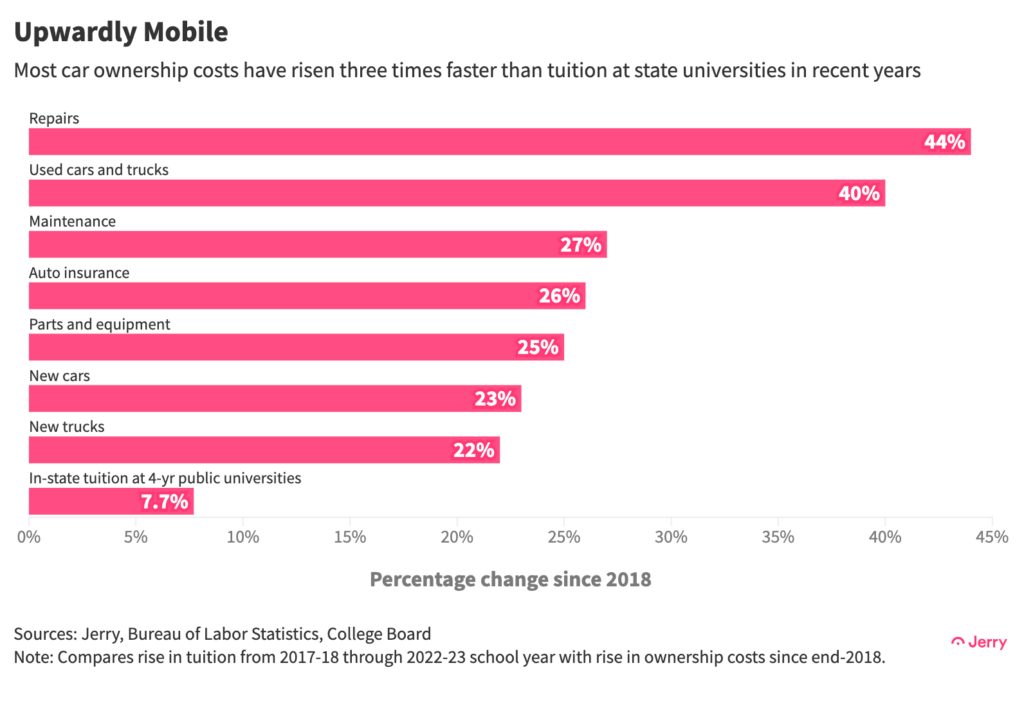
How did we get here? Blame soaring prices for auto insurance, maintenance and car repairs, vehicle prices and parts, and gasoline. They’ve all risen at least three times faster than tuition at state universities over the past five years, with the exception of new trucks, which have risen nearly three times faster. The recent jump in interest rates has also played a role.

Key Insights
- It costs $11,378 a year for a teen to own and drive a new car, more than the average annual in-state tuition at a four-year public university ($10,940) and more than double the in-state tuition at the cheapest flagship state university, the University of Florida.
- A teenager responsible for paying for their own car by working a typical service industry job would need to work 54 hours a week over a 15-week summer to pay the costs of owning a new car for a year, or 16 hours a week for 52 weeks a year as they balance work and school. They must work 49 hours a week during the summer, or 14 hours a week for an entire year, to own and drive a 2018 Camry.
- Since 2018, most car ownership costs have risen three times as fast as in-state tuition at four-year public universities.
- It costs $829 a year more to insure a teen driver than the average person, according to data analysis by Jerry.
A Premium for Insurance
Car ownership costs surpassing in-state college tuition serves as another marker in a growing crisis of affordability for American drivers. Nearly every ownership cost has soared in recent years, rising at a much faster rate than tuition at public universities. The COVID-19 pandemic pushed vehicle prices sharply higher, while maintenance and repair costs and auto insurance have been rising for longer.

Most Americans (71%) say auto insurance is becoming unaffordable to the average family, and insurance costs inflict more financial stress on teen drivers and their parents than they do on the average driver. So it’s little surprise that a recent survey by Jerry found that parents of teen drivers are more stressed out and more likely to shop around and switch insurance providers for a lower rate.
Seventy percent of parents of a teen driver said they shopped around for insurance in the previous year, versus 43% of respondents who weren’t parents of teens. One in four (24%) parents of a teen said they switched insurers to get a lower price, compared to 14% of their counterparts. Nearly one in five (18%) of parents of teen drivers said auto insurance caused them a high or extreme level of financial stress in the previous year, compared to 12% of all drivers.
Pay as You Go?
It was once an article of faith that an industrious American teenager could buy a used vehicle (and even pay for college) by working a menial job, whether during the summers or part-time during school years. Now it’s a different story.
The average hourly wage for fast food workers, lifeguards, retail salespeople, and amusement and recreation attendants is now $14.08. At that rate, someone would have to work 49 hours a week over a 15-week summer, or 14 hours a week for 52 weeks a year, to cover the cost of owning and driving a 2018 Toyota, assuming they financed the vehicle. That would leave little time for a life, much less money to pay for college. Which begs the question, will some teens be left to decide between transportation and higher education?
No wonder some studies have concluded that shifting economics explains much of the difference in attitudes toward driving and car ownership among Millennials and Gen Z.
Methodology
A teenager’s cost of ownership for a new vehicle was calculated using AAA’s driving costs calculator, and adding the difference in insurance costs between teen drivers and those over 19 years old ($829 a year). The annual mileage was set at 10,000, the choice closest to the 7,200 miles a year driven by the average teen, according to the U.S. Federal Highway Administration. The cost of ownership for a 2018 Toyota Camry for a teenager was calculated the same way.
When comparing increases in tuition and the costs of car ownership, we compared tuition in the 2017-18 academic year with the 2022-23 school year, and car ownership costs from end-2018 through July 2023. All tuition figures were taken from the College Board.
The average wage for fast food workers, lifeguards, retail salespeople, and amusement and recreation attendants was reached by calculating the average of those individual jobs as listed by the U.S. Bureau of Labor Statistics.

Henry Hoenig previously worked as an economics editor for Bloomberg News and a senior news editor for The Wall Street Journal. His data journalism at Jerry has been featured in outlets including CBS News, Yahoo! Finance, FOX Business, Business Insider, Bankrate, The Motley Fool, AutoWeek, Money.com and more.


