People love to hate Tesla drivers, who may have replaced BMW drivers as the most loathed on the road. Founder Elon Musk’s antics haven’t helped. It’s gotten so bad, Tesla owners say, that they are frequent targets of harassment, vandalism and road rage.
With all that in mind, Jerry looked at data on Tesla drivers to see who they are and how they drive. Here’s what we found:
- Tesla drivers scored worse than 98% of all drivers in acceleration safety, according to data analysis by Jerry. The blame may lie with Tesla’s “Insane”, “Ludicrous” and “Plaid” modes, which put world-best acceleration at the average driver’s fingertips. Sudden bursts of speed push acceleration scores lower.
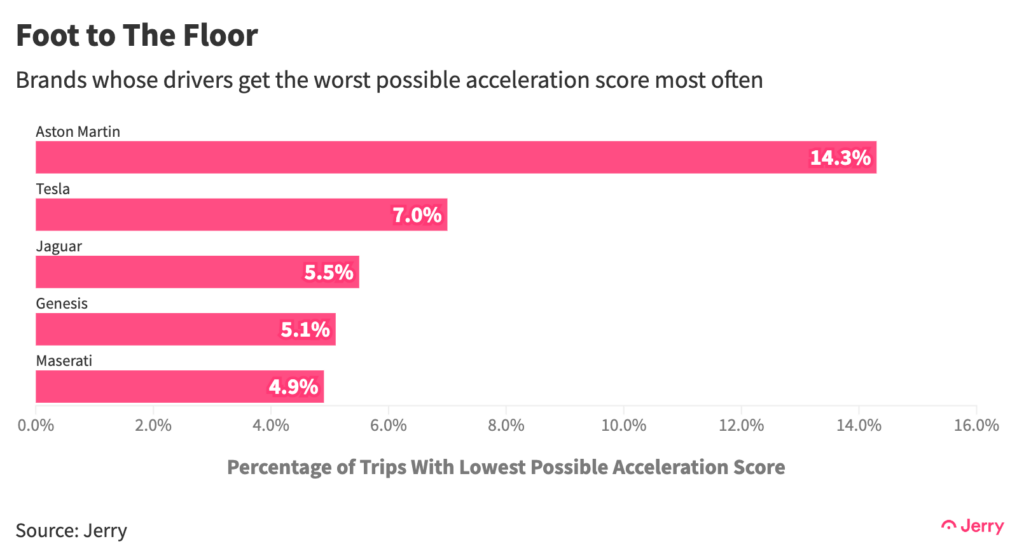
- Only drivers of supercar brands Aston Martin (3.94) and Maserati (4.24) scored worse in acceleration than Tesla drivers (4.37), but there were so few Aston Martin samples in the dataset that the difference in scores could easily have been due to random chance. Which means that Maserati drivers are the only ones who clearly like to floor it more than Tesla drivers. Drivers of Genesis (4.41) and Jaguar (4.55) rounded out the bottom five for worst acceleration scores.
- Tesla drivers also scored below average for overall safety, though the difference with the average score was modest and hard to quantify in non-numeric terms.
- Trips by Tesla drivers resulted in the worst possible acceleration score (1 out of 5) more than four times as often as non-Tesla drivers, and more often (7% of trips) than drivers of any other make except Aston Martin (14.3%).

- Tesla drivers also have slightly lower-than-average speed scores, a measure of speed relative to the speed limit. But the difference isn’t statistically significant and Tesla drivers’ average speed and average top speed were both lower than those of non-Tesla drivers. So, while Tesla drivers appear keen to get Ludicrous with acceleration, they apparently aren’t big on testing their vehicles’ top speeds.
- One area where Tesla drivers outperformed was the distraction score, which is based on handling smartphones while driving. (The less you handle your phone while driving, the higher your score.) Tesla drivers ranked 10th out of drivers of 52 vehicle brands. This certainly helped prop up Tesla drivers’ overall safety score. Who earned the best distraction score? Aston Martin drivers. Perhaps extreme acceleration keeps drivers focused on the road. Tesla drivers’ 15-inch touchscreens may also be beating their smartphones in attracting their attention.
- So who is behind the wheel of that Tesla? Well, 83% of Tesla drivers in the dataset Jerry examined were male, compared to only 49% of drivers of all other vehicles. Surprising to no one, one third of Tesla drivers have a master’s degree or Ph.D., and the three most common occupations are engineer, manager of operations, and software engineer.
Conclusion
So what do we know about Tesla drivers? They are mostly male and more likely than average to be highly educated with a technological bent. They enjoy bursts of acceleration but not high speeds, and they are better than average at keeping their hands off their phones while driving. That’s what the data says, anyway. We’ll leave the more subjective judgments to others.
Methodology
Jerry examined safety scores and other data from 10 million trips taken by 62,000 drivers in 52 different makes of vehicles. That included more than 30,000 trips by 228 Tesla drivers.
To compare the scores of Tesla drivers with drivers of other individual brands, we calculated the average scores for each driver, based on their trip scores, and then the averages for all drivers of a particular make. (Overall scores are not calculated by averaging sub-scores; risk factors from each “risk event” are weighted differently, and frequency is taken into account, when calculating the overall score.)
We also conducted statistical tests to rule out random chance as a factor in the differences in the scores, using a probability of less than 5% as the threshold. Random chance could not be ruled out in the speed, braking and turning categories when comparing Tesla to non-Tesla drivers.
(An earlier version of this study misstated the percentages of Tesla and non-Tesla drivers with clean driving records.)

Henry Hoenig previously worked as an economics editor for Bloomberg News and a senior news editor for The Wall Street Journal. His data journalism at Jerry has been featured in outlets including CBS News, Yahoo! Finance, FOX Business, Business Insider, Bankrate, The Motley Fool, AutoWeek, Money.com and more.


