America’s fentanyl epidemic is spilling onto its roads and highways.
The massive influx of fentanyl, a synthetic opioid, drove deaths from drug overdoses 30% higher in 2020 and another 15% higher in 2021, to a record 110,000 in 2022. So it should come as little surprise that more drivers have fentanyl in their system.
The number of drivers involved in fatal accidents who tested positive for fentanyl nearly doubled from 2018 through 2021, the latest year for which data is available, despite little change in the number of tests conducted. The percentage of those drivers testing positive for fentanyl doubled from 2% to 4%. In New Hampshire, the state with the highest rate, fentanyl was found in the system of 11% of all drivers in fatal crashes who were tested for drugs.
Jerry took a closer look at the available data on fentanyl and fatal traffic crashes in an effort to gauge just how much America’s fentanyl epidemic has also become a road-safety problem. Here’s what else we found:
Key Insights
- While the number of drivers in fatal crashes who were tested for drugs rose only 0.4% from 2018 through 2021, the number of drivers who tested positive for fentanyl nearly doubled, jumping 93% from 422 in 2018 to 815 in 2021, the latest year for which data is available.
- Of all drivers involved in fatal crashes from 2018 through 2021, 3.1% of those who were tested for drugs had fentanyl in their system. Non-drivers (passengers and pedestrians) in those same crashes tested positive at an even higher rate: 4.4% who were tested had fentanyl in their system.
- The fentanyl positivity rate for drivers who were tested rose from 2% in 2018 to 4% in 2021, while the rate for non-drivers who were tested rose from 3.1% to 5.9%.
- States on the East Coast dominate the list of those with the highest rates of positive tests for fentanyl among drivers involved in fatal crashes. The rate topped 5% in 12 different states.
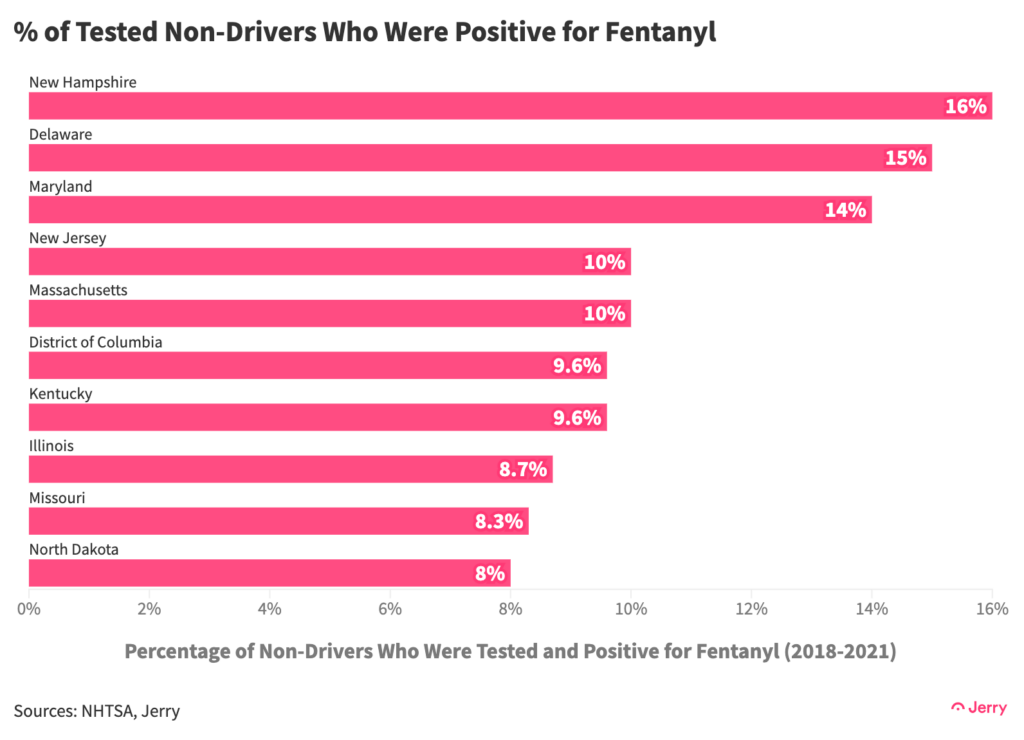
- In New Hampshire, 11% of drivers involved in fatal accidents who were tested for drugs were found to be positive for fentanyl, while the same was true for 16% of non-drivers in the same crashes who were tested. Both of those numbers were the highest in the U.S.
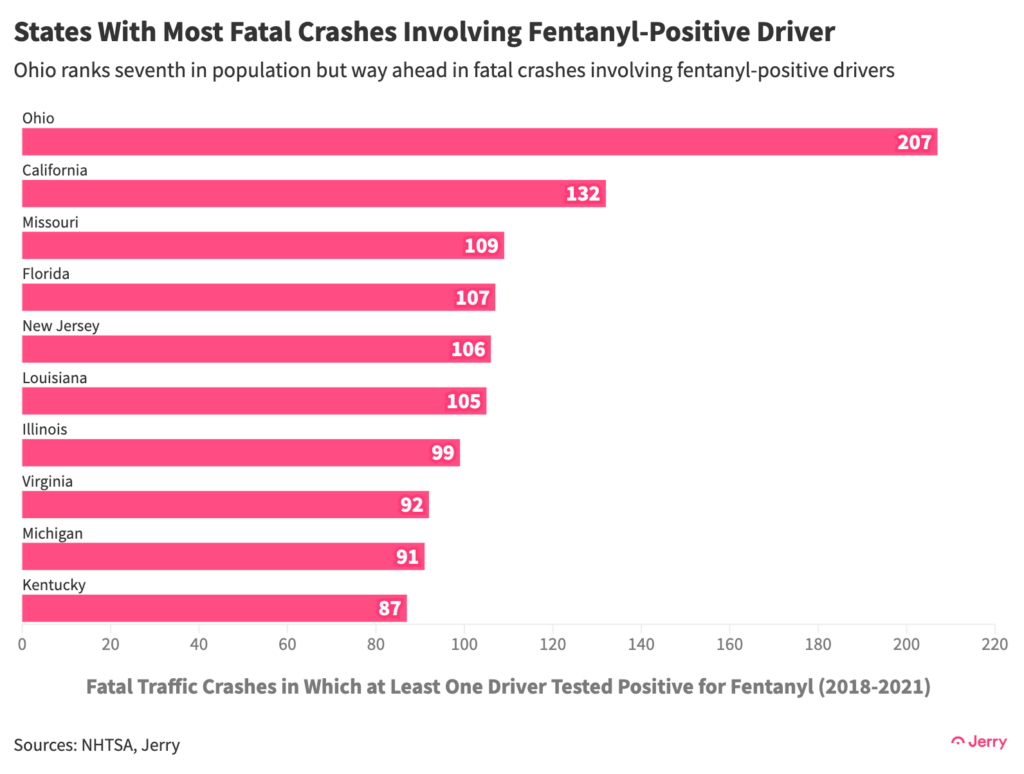
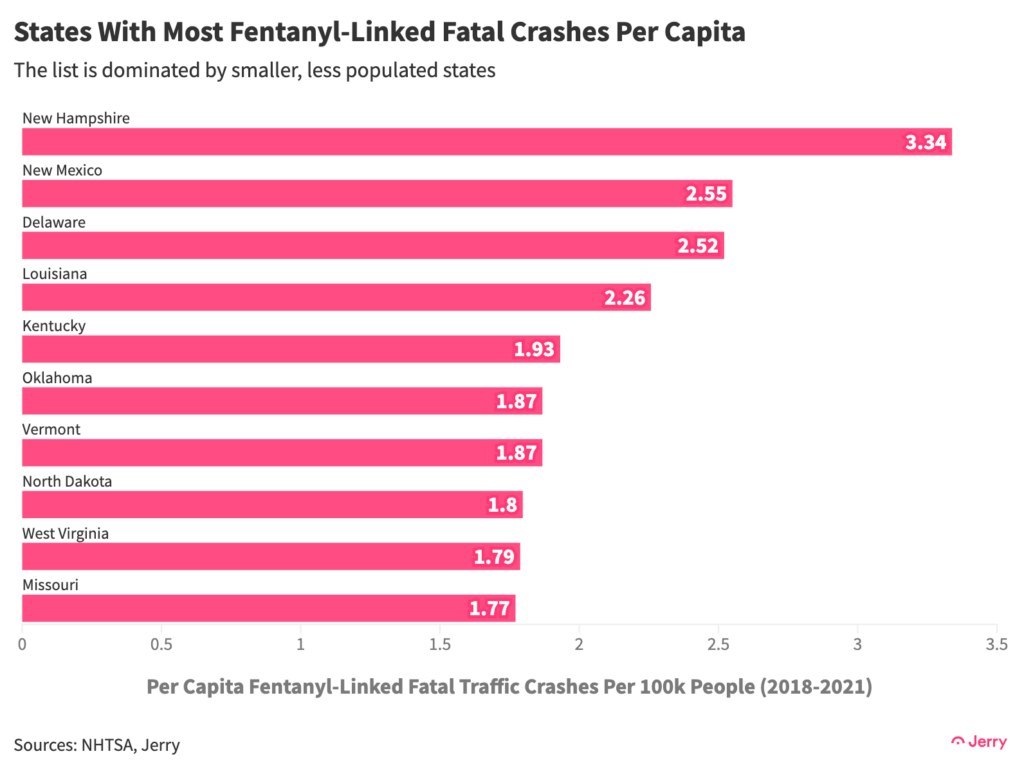
- Ohio saw the most fatal crashes in which at least one driver tested positive for fentanyl—roughly double the number, at least, of any other state except California. New Hampshire led the country on a per capita basis, followed by New Mexico and Delaware.
- The number of people involved in fatal crashes who test positive for fentanyl remains relatively low. In 2021, more than 10,000 drivers involved in fatal accidents were found to have been drinking, compared to 815 drivers who tested positive for fentanyl. That’s because relatively few people involved in fatal accidents are tested for drugs.
- Testing rates vary dramatically by state. Nationwide, a drug test was conducted on at least one driver in only about half (49%) of fatal crashes. And a test was conducted on only 37% of all drivers involved in fatal crashes, and 21% of non-drivers.
Proof Positive
Led by New Hampshire and Maine, states on the East Coast dominate the list of those with the highest rates of positive tests for fentanyl among drivers in fatal crashes. The rate topped 5% in 12 different states.

Nationally, non-drivers (passengers and pedestrians) involved in fatal crashes tested positive for fentanyl at higher rates than drivers. Three East Coast states—New Hampshire, Delaware and Maryland—saw positive test results for fentanyl among non-drivers at more than three times the national average (4.4%).
State Rankings
Ohio saw the most fatal crashes in which at least one driver tested positive for fentanyl—roughly double the number, at least, of any other state except California.
On a per capita basis, New Hampshire saw by far the most fatal crashes involving at least one fentanyl-positive driver. Delaware again sits near the top of the list. Smaller states such as Kentucky, Vermont, and West Virginia also make the list.
City Rankings
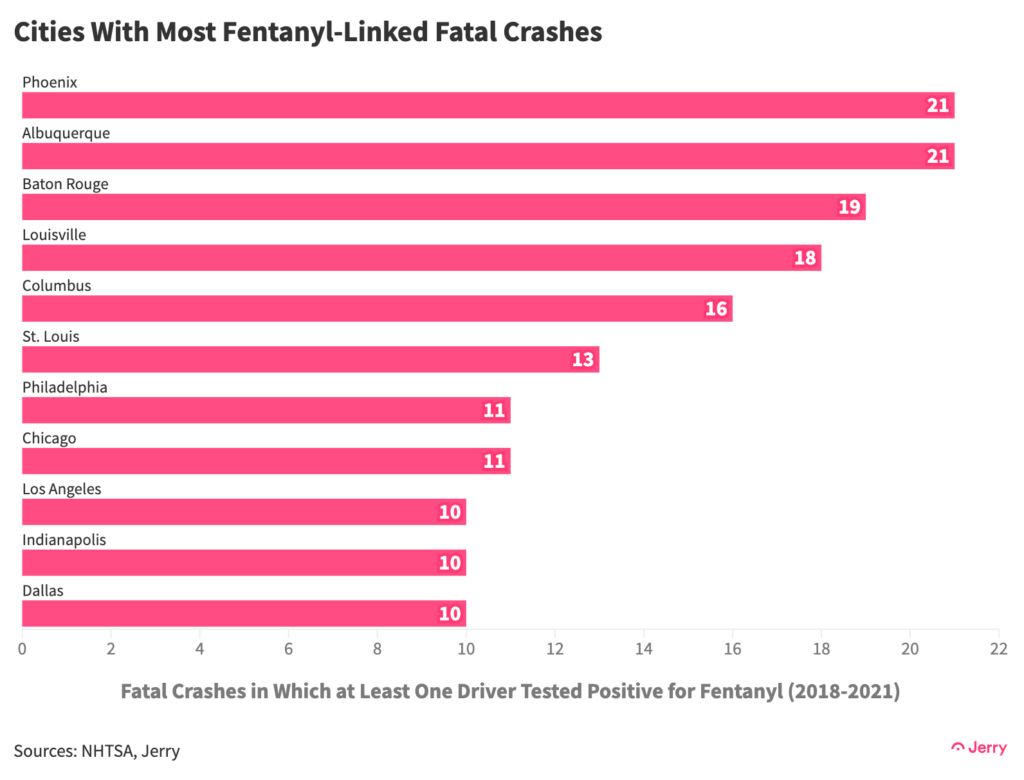
Two cities in the Southwest—Phoenix and Albuquerque—topped the list of cities with the most fatal crashes involving at least one fentanyl-positive driver. The smaller cities Baton Rouge and Louisville ranked third and fourth, respectively.
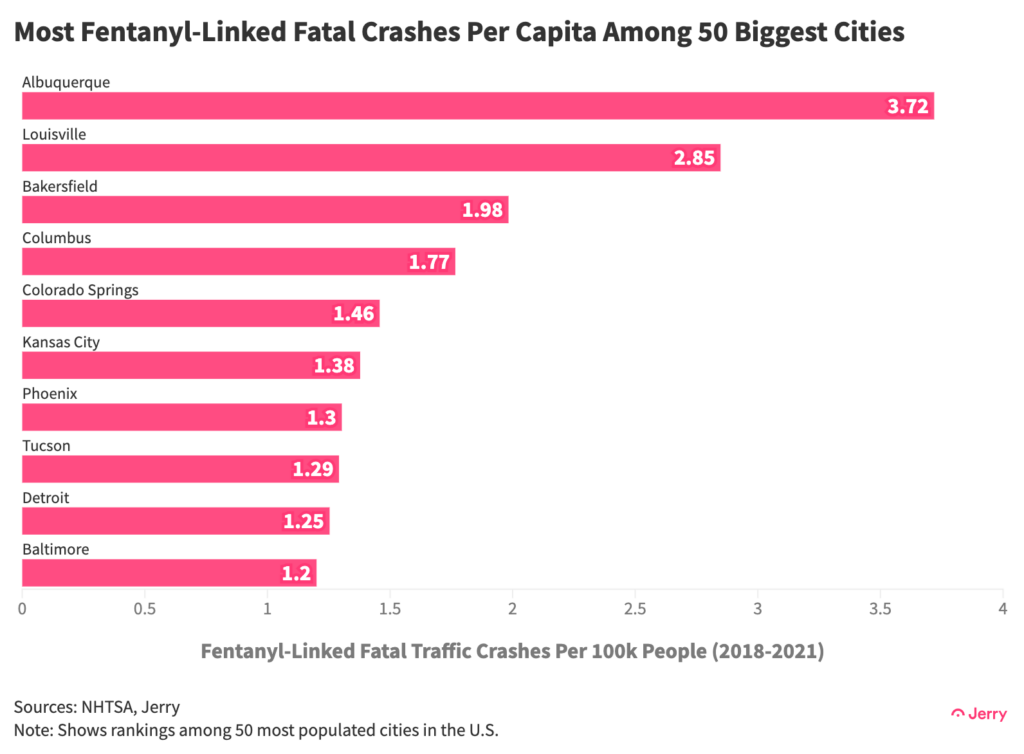
Among the nation’s 50 most populous cities, Albuquerque saw the most fatal crashes involving at least one fentanyl-positive driver per capita. Albuquerque’s per capita rate is at least double that of any other of the nation’s 50 biggest cities except Louisville and Bakersfield. Phoenix and Tucson both make the list.
County Rankings
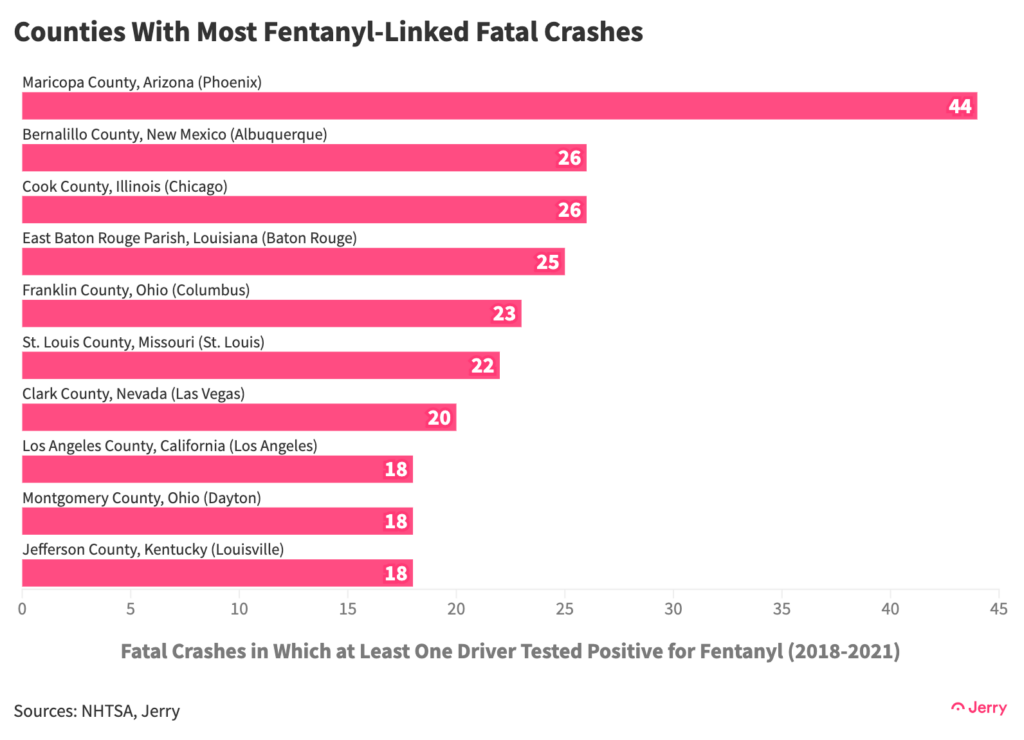
Maricopa County, home of Phoenix, ranks first in total fatal crashes involving at least one driver who tested positive for fentanyl. Albuquerque’s Bernalillo County and Chicago’s Cook County rank second and third, respectively.
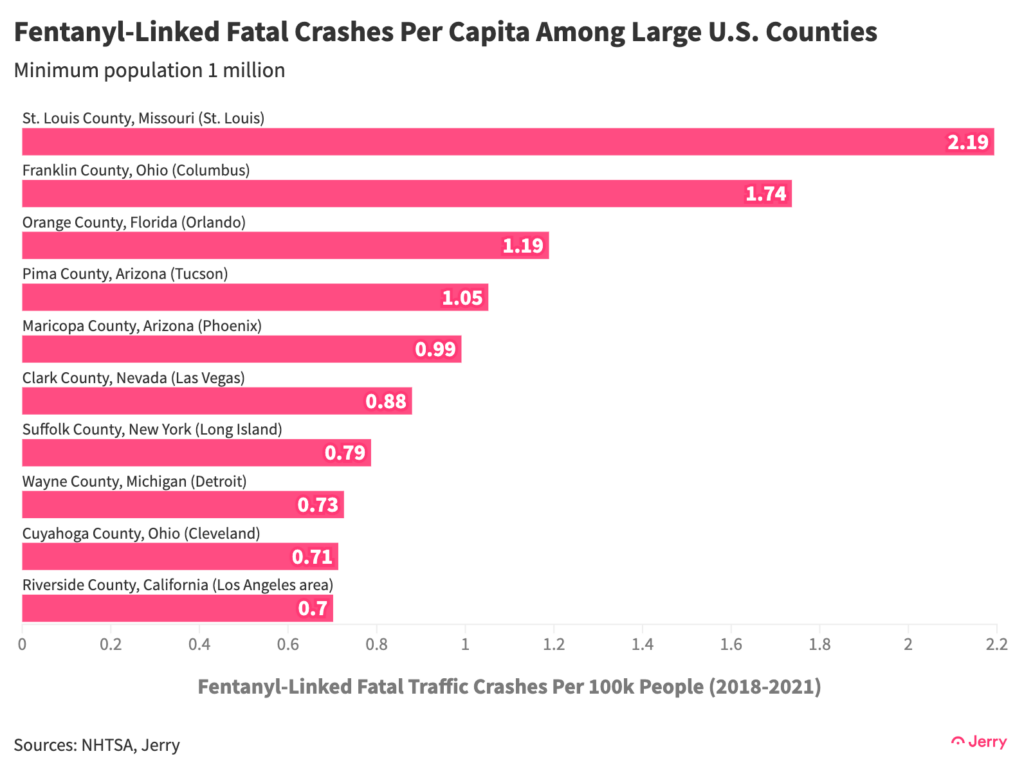
Among counties with a population of at least 1 million, St. Louis County has by far the highest per capita rate of fatal crashes involving at least one fentanyl-positive driver. Phoenix’s Maricopa County, the clear leader in the total number of such crashes, also ranks high in the per capita rankings among large counties.
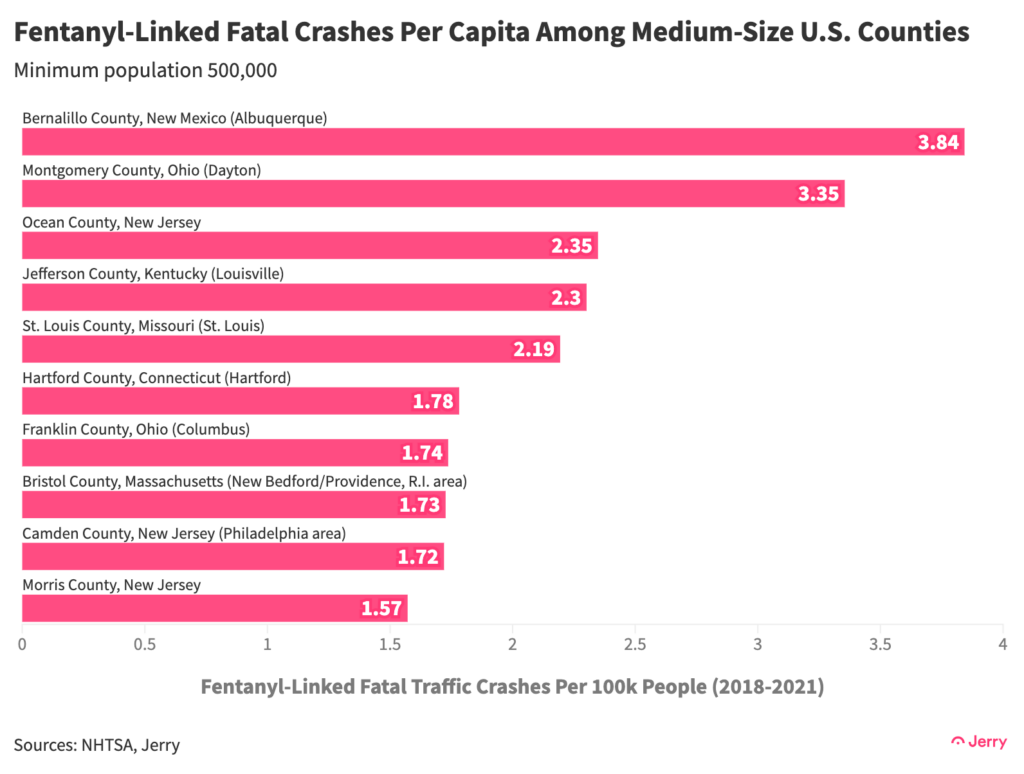
Albuquerque’s Bernalillo County sits atop the list of medium-size counties with the highest per capita rate of fatal crashes involving at least one fentanyl-positive driver. Three counties in New Jersey also made the list.
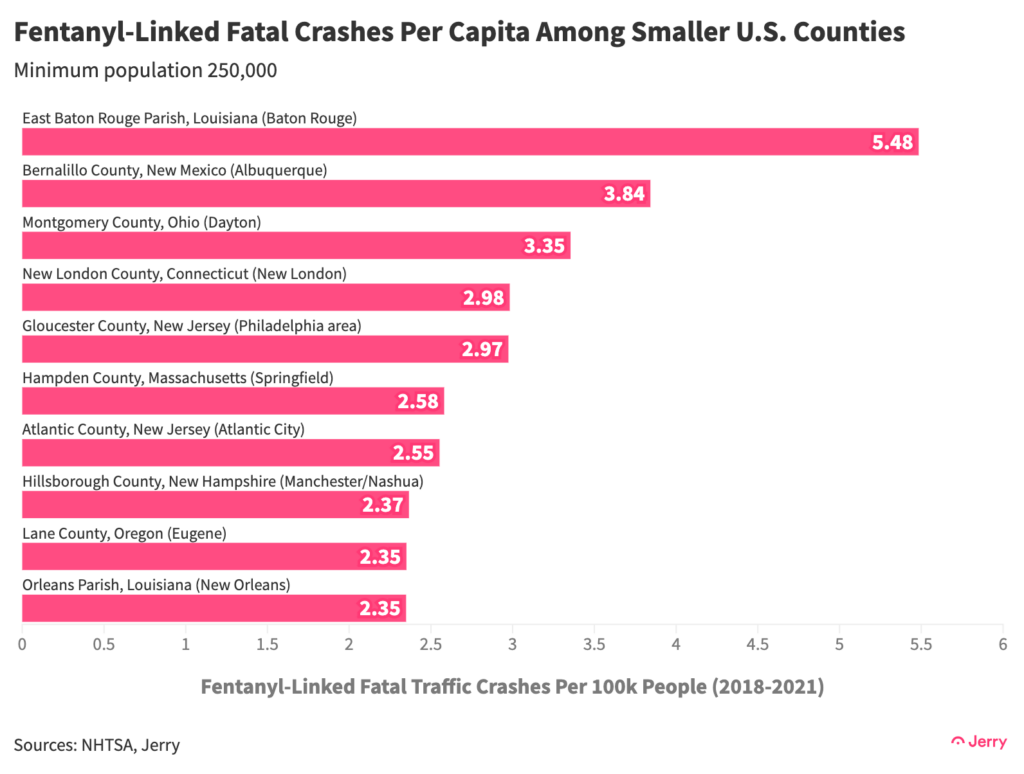
When smaller counties are included, East Baton Rouge, Louisiana, stands out. Its per capita rate is at least double every other county in the country except four, excluding those with a population under 250,000. Albuquerque’s Bernalillo County again sits near the top of the list.
Conclusion
The different rates of testing make it difficult to estimate just how many drivers on America’s roads have fentanyl in their system. More comprehensive and consistent testing would help fill in the picture. But the data clearly shows the number of fentanyl-positive drivers involved in fatal crashes has grown, as has the rate of positive test results. The data also shows that among those who were tested, the percentage who have fentanyl in their system is significant.
Methodology
All crash and drug-test data is from the National Highway Traffic Safety Administration (NHTSA). All population data was gathered from the U.S. Census Bureau.
he NHTSA only began collecting data from states on fentanyl in fatal crashes in 2018. The frequency of drug testing of drivers and passengers in fatal crashes, and the processes involved, vary from state to state. Not all drivers and passengers involved in a fatal crash are tested for drugs. Fentanyl can be detected in a blood test for up to 48 hours after ingestion. The presence of fentanyl in a driver’s bloodstream does not necessarily mean that the driver was impaired at the time of the crash.

Henry Hoenig previously worked as an economics editor for Bloomberg News and a senior news editor for The Wall Street Journal. His data journalism at Jerry has been featured in outlets including CBS News, Yahoo! Finance, FOX Business, Business Insider, Bankrate, The Motley Fool, AutoWeek, Money.com and more.

