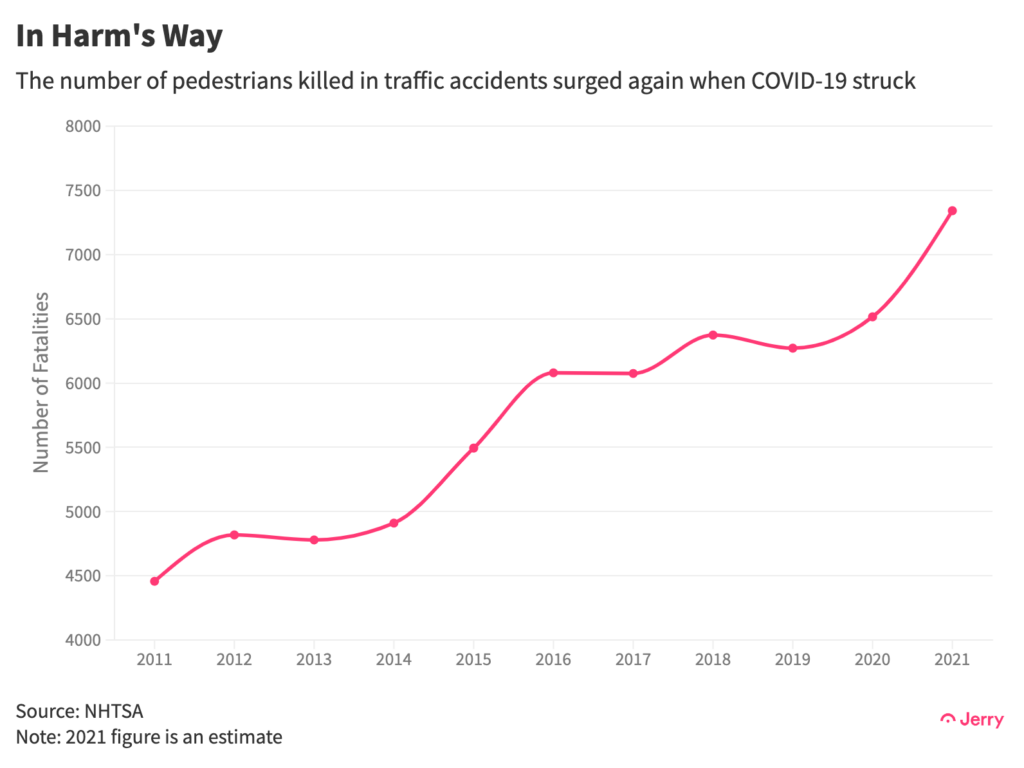
As America’s driving grows more aggressive, reckless and distracted, no one is more vulnerable than the people simply walking across or along the nation’s streets and roads. The number of pedestrians killed each year has reached a four-decade high, and is rising at twice the rate as surging overall traffic fatalities, according to data analysis by Jerry. Last year, drivers killed more than 7,000 pedestrians.
We examined 10 years of crash data to better understand the huge increase in pedestrian fatalities. Here’s what we found:
Key Insights
- The number of pedestrians killed by drivers each year rose 65% from 2011 through 2021, when they totaled 7,342, the highest number in four decades.
- In 2021, pedestrian fatalities rose 13% from the previous year. Nearly one in five traffic fatalities that year was a person on foot.
- Minorities are more likely to die as pedestrians on America’s roads. In 2020, the most recent year for which such data was available, Black people accounted for 19% of pedestrian fatalities but only 13.6% of the population. White people accounted for only 37% of pedestrian deaths but 76% of the population.
- Passenger cars still kill more pedestrians every year than SUVs (2,528 vs. 1,313 in 2020), but the number of pedestrians killed by an SUV grew twice as fast from 2011 to 2020 as those killed by passenger cars (76% vs. 37%).
- Nearly a third of pedestrians killed in 2020 had a blood-alcohol level of at least 0.08, the legal limit used to define drunk driving. A quarter had a level of 0.15, nearly twice the legal limit.
- From 2011 to 2020, only 26% of pedestrian fatalities occurred at an intersection, while 91% of pedestrians were on the roadway when they were struck. This indicates most victims were either crossing a road where there was no pedestrian crosswalk or walking along a road with no sidewalk.
- Four of every five pedestrian deaths occur in an urban area.
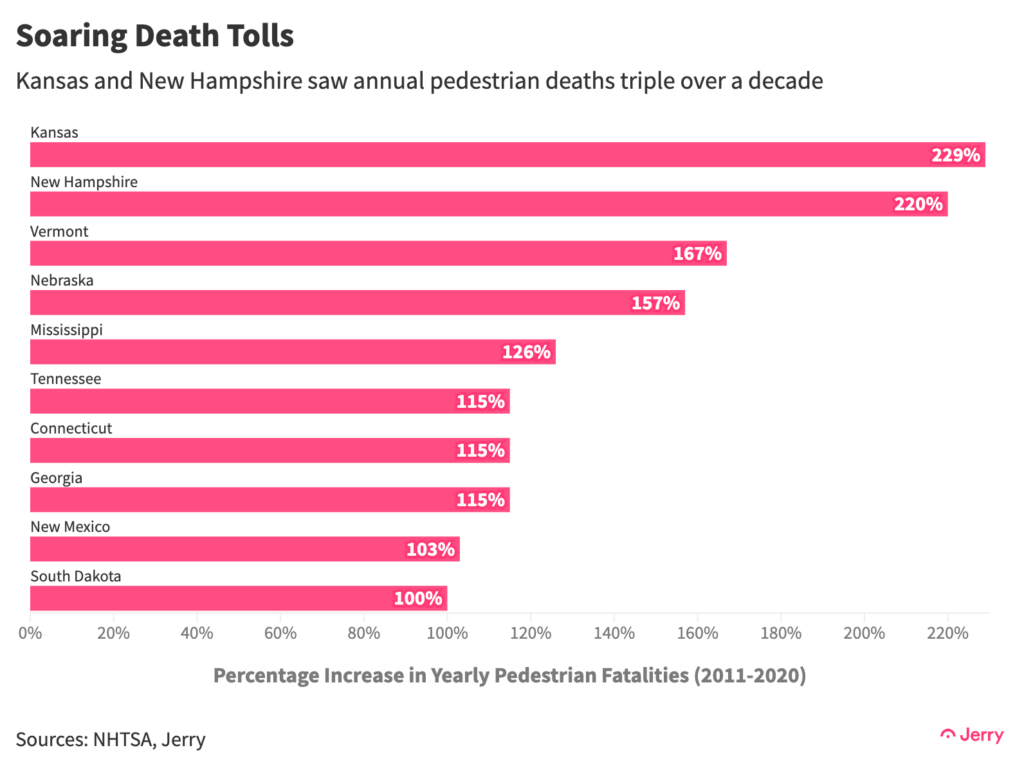
Pedestrian deaths doubled in 10 states from 2011 through 2020. The number tripled in two states, Kansas and New Hampshire. Only eight states experienced a decline: Massachusetts, New York, Wisconsin, North Dakota, West Virginia, Maine, Hawaii and Pennsylvania.
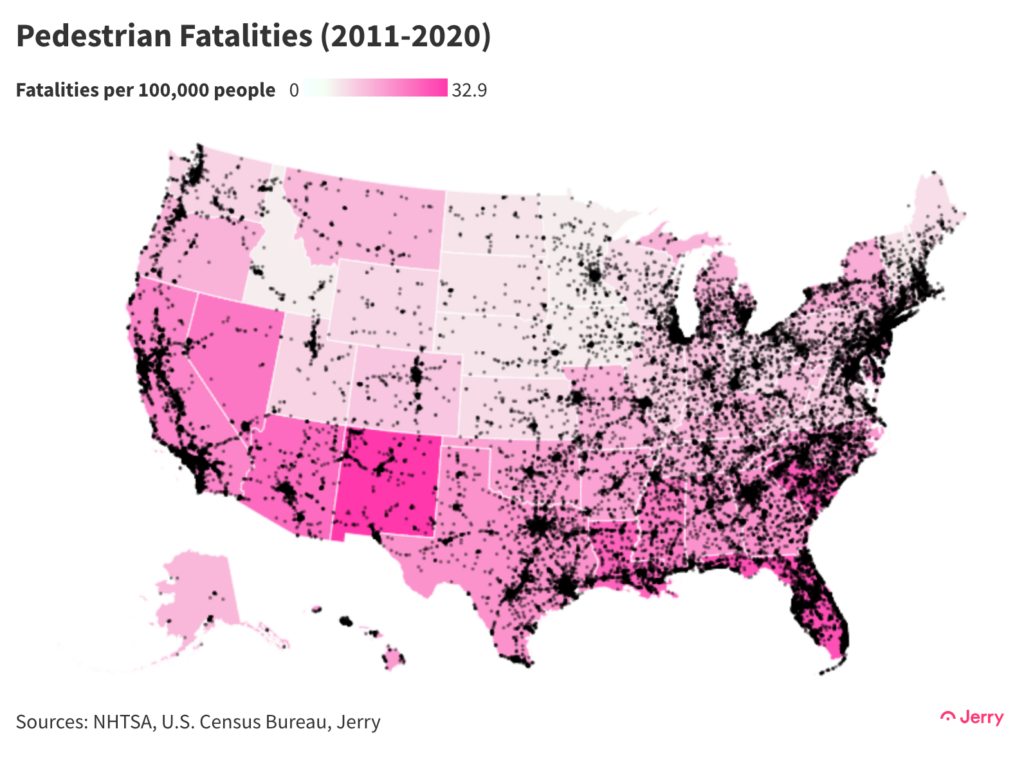
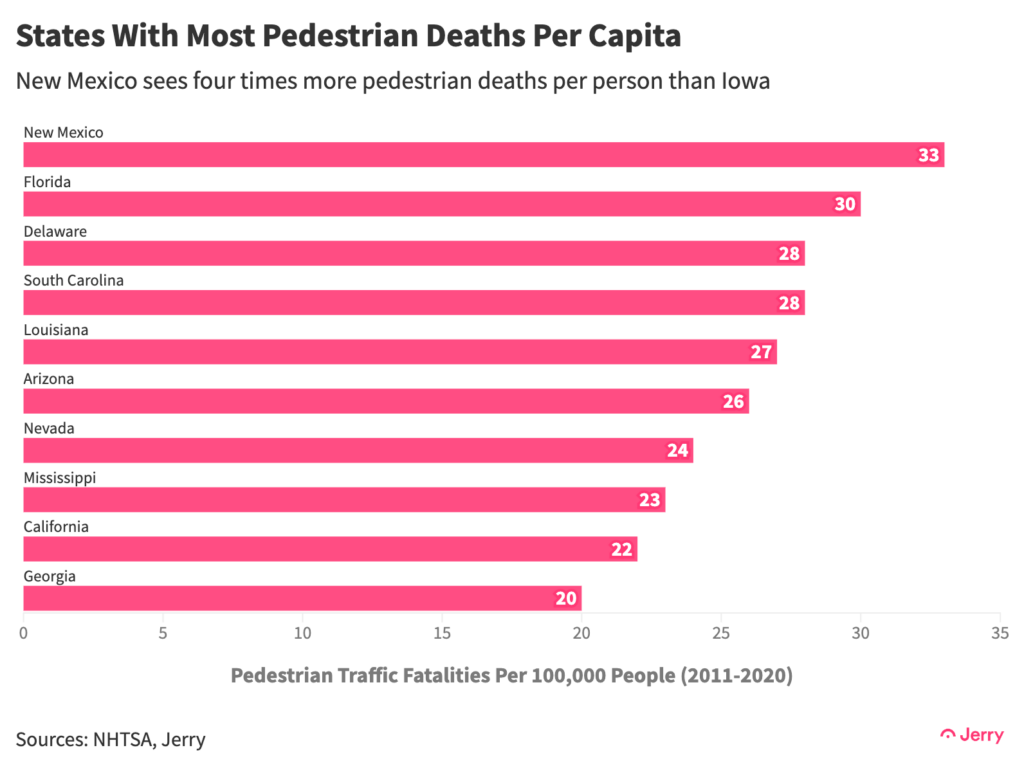
Nearly all of the states with the most pedestrian fatalities per capita are located in the South, Southwest or West.
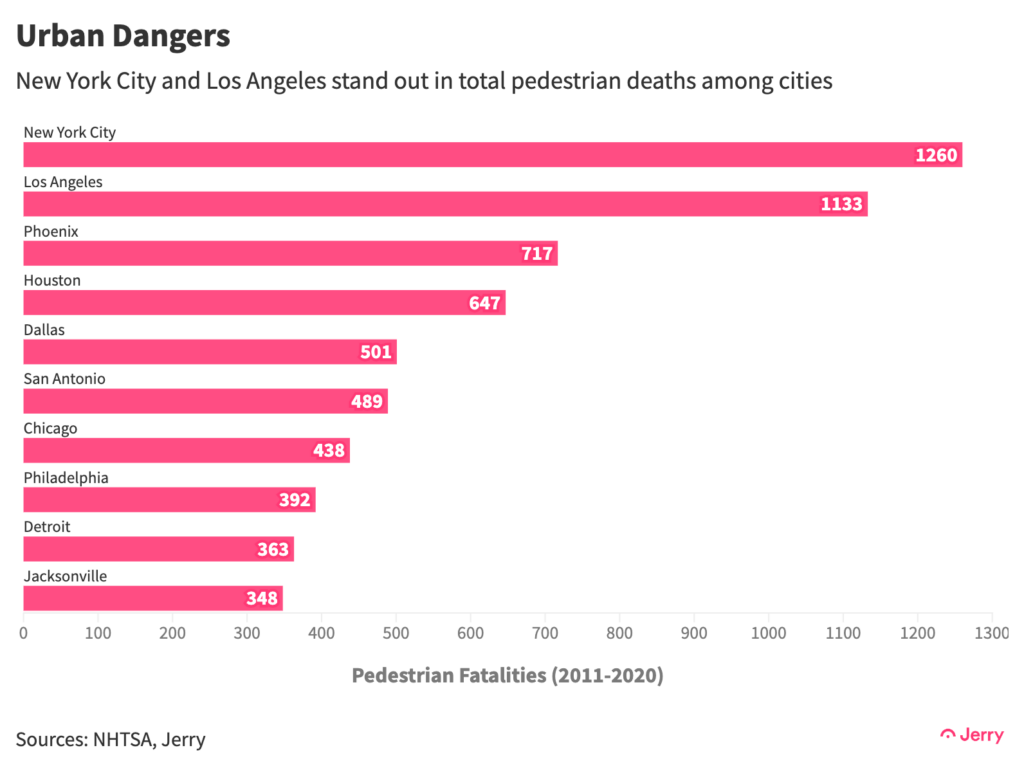
Far smaller geographically, New York topped freeway-heavy Los Angeles in total pedestrian deaths. Three Texas cities rank among the six deadliest for pedestrians.
Conclusion
There are likely many factors behind the dramatic rise in pedestrian deaths. We have seen a surge in aggressive driving and overall traffic fatalities since the outbreak of COVID-19, which can be at least partly blamed on mental stress resulting from the challenges of navigating the pandemic. American drivers’ passion for ever-bigger vehicles is also cited as playing a role. Sport-utility vehicles are far heavier and therefore deadlier to anyone they hit than your average passenger car. And alcohol consumption by pedestrians clearly plays a role.
Ultimately, most of America’s roads are profoundly unfriendly to pedestrians, making the factors above that much deadlier. There are far too few sidewalks and pedestrian crossings and too many high-speed, high-traffic-volume roads cutting through densely populated urban areas. As long as that’s the case, being a pedestrian in the U.S. will be riskier than it should be.
Methodology
Jerry used fatal crash data from the National Highway Traffic Safety Administration from 2011 through 2020 (and preliminary estimates for total fatalities for 2021). To calculate per capita fatalities, we used population data from the U.S. Census Bureau.

Henry Hoenig previously worked as an economics editor for Bloomberg News and a senior news editor for The Wall Street Journal. His data journalism at Jerry has been featured in outlets including CBS News, Yahoo! Finance, FOX Business, Business Insider, Bankrate, The Motley Fool, AutoWeek, Money.com and more.


